Americans With Credit Card Debt Aren't Reckless. They're Committed.
Get the personalized version
Where do you actually sit on this curve?
The chart shows averages. We’ll email you the personalized version — your stage’s stats, the 5 expenses driving CC debt at your age, and the 3 patterns we see in households who break the cycle earlier.
Key findings
- About 32% of US households (~43 million) carry a credit card balance month to month.
- The median revolver has $3,500 in card debt and $3,900 in liquid savings — they could pay it off today and don't.
- Revolvers carry roughly 2× more total debt as a multiple of income than people who pay in full — most of it in car loans and student loans, not on credit cards.
- They save for the exact same things (retirement, emergencies, home, kids) as people who pay in full — just at half the rate.
- The data point to a forecasting problem, not a discipline problem.
I spent the week inside the Federal Reserve’s 2022 Survey of Consumer Finances trying to figure out what actually separates Americans who carry credit card debt from people who pay in full each month. The answer surprised me.
The story we usually tell ourselves about credit card debt is that people who carry a balance are reckless. They overspend. They don’t get compounding. They never learned to budget. If only they had more discipline, they’d be fine.
It’s pretty much the opposite.
Start with the numbers that don’t fit
About a third of US households — roughly 43 million homes — say they “sometimes” or “hardly ever” pay their credit card balance in full each month. Call them revolvers. About half of US households are the opposite: people who pay in full almost every month. Transactors.
Here’s the first thing that surprised me. The median revolver carries about $3,500 in credit card debt.
They also have about $3,900 in their checking and savings accounts.
Look, $3,500 isn’t a lot of credit card debt. And $3,900 isn’t a lot of cash. But the relevant fact is the two numbers are right on top of each other. The median American carrying revolving debt could pay it off today and have a few hundred bucks left over. They don’t, but they could.
If credit card debt were the discipline problem we usually frame it as, you’d expect revolvers to look broke. They don’t. The median revolver earns about $71,000 a year — below the U.S. median, but solidly middle class. Their median net worth is about $119,000. More than half own their home. They’re not the caricature the financial advice industry has been selling.
So if it’s not that they’re broke, and it’s not that they’re saving for different things (we’ll get there), what’s actually different about them?
Three patterns
Three things jumped out of the data. The first is what you’d expect. The second is interesting. The third is the one I keep going back to.
1. Revolvers are committed roughly twice as deeply
This was the cleanest finding in the data. Compare the median revolver to the median transactor:
| Pays in full | Revolves | |
|---|---|---|
| Debt-to-income ratio | 0.48 | 1.00 |
| Installment debt (cars, student loans, etc.) | $0 | $11,000 |
| Has a vehicle loan | 33% | 48% |
| Has student loans | 18% | 32% |
| Debt service consuming >40% of income | 4% | 11% |
Revolvers carry roughly twice as much total debt as a multiple of income. And most of that extra debt isn’t on credit cards. It’s in long-term installment obligations — car loans, student loans, often both. (You can see how your own debt compares to U.S. households at your age and income with the Debt Percentile Calculator.)
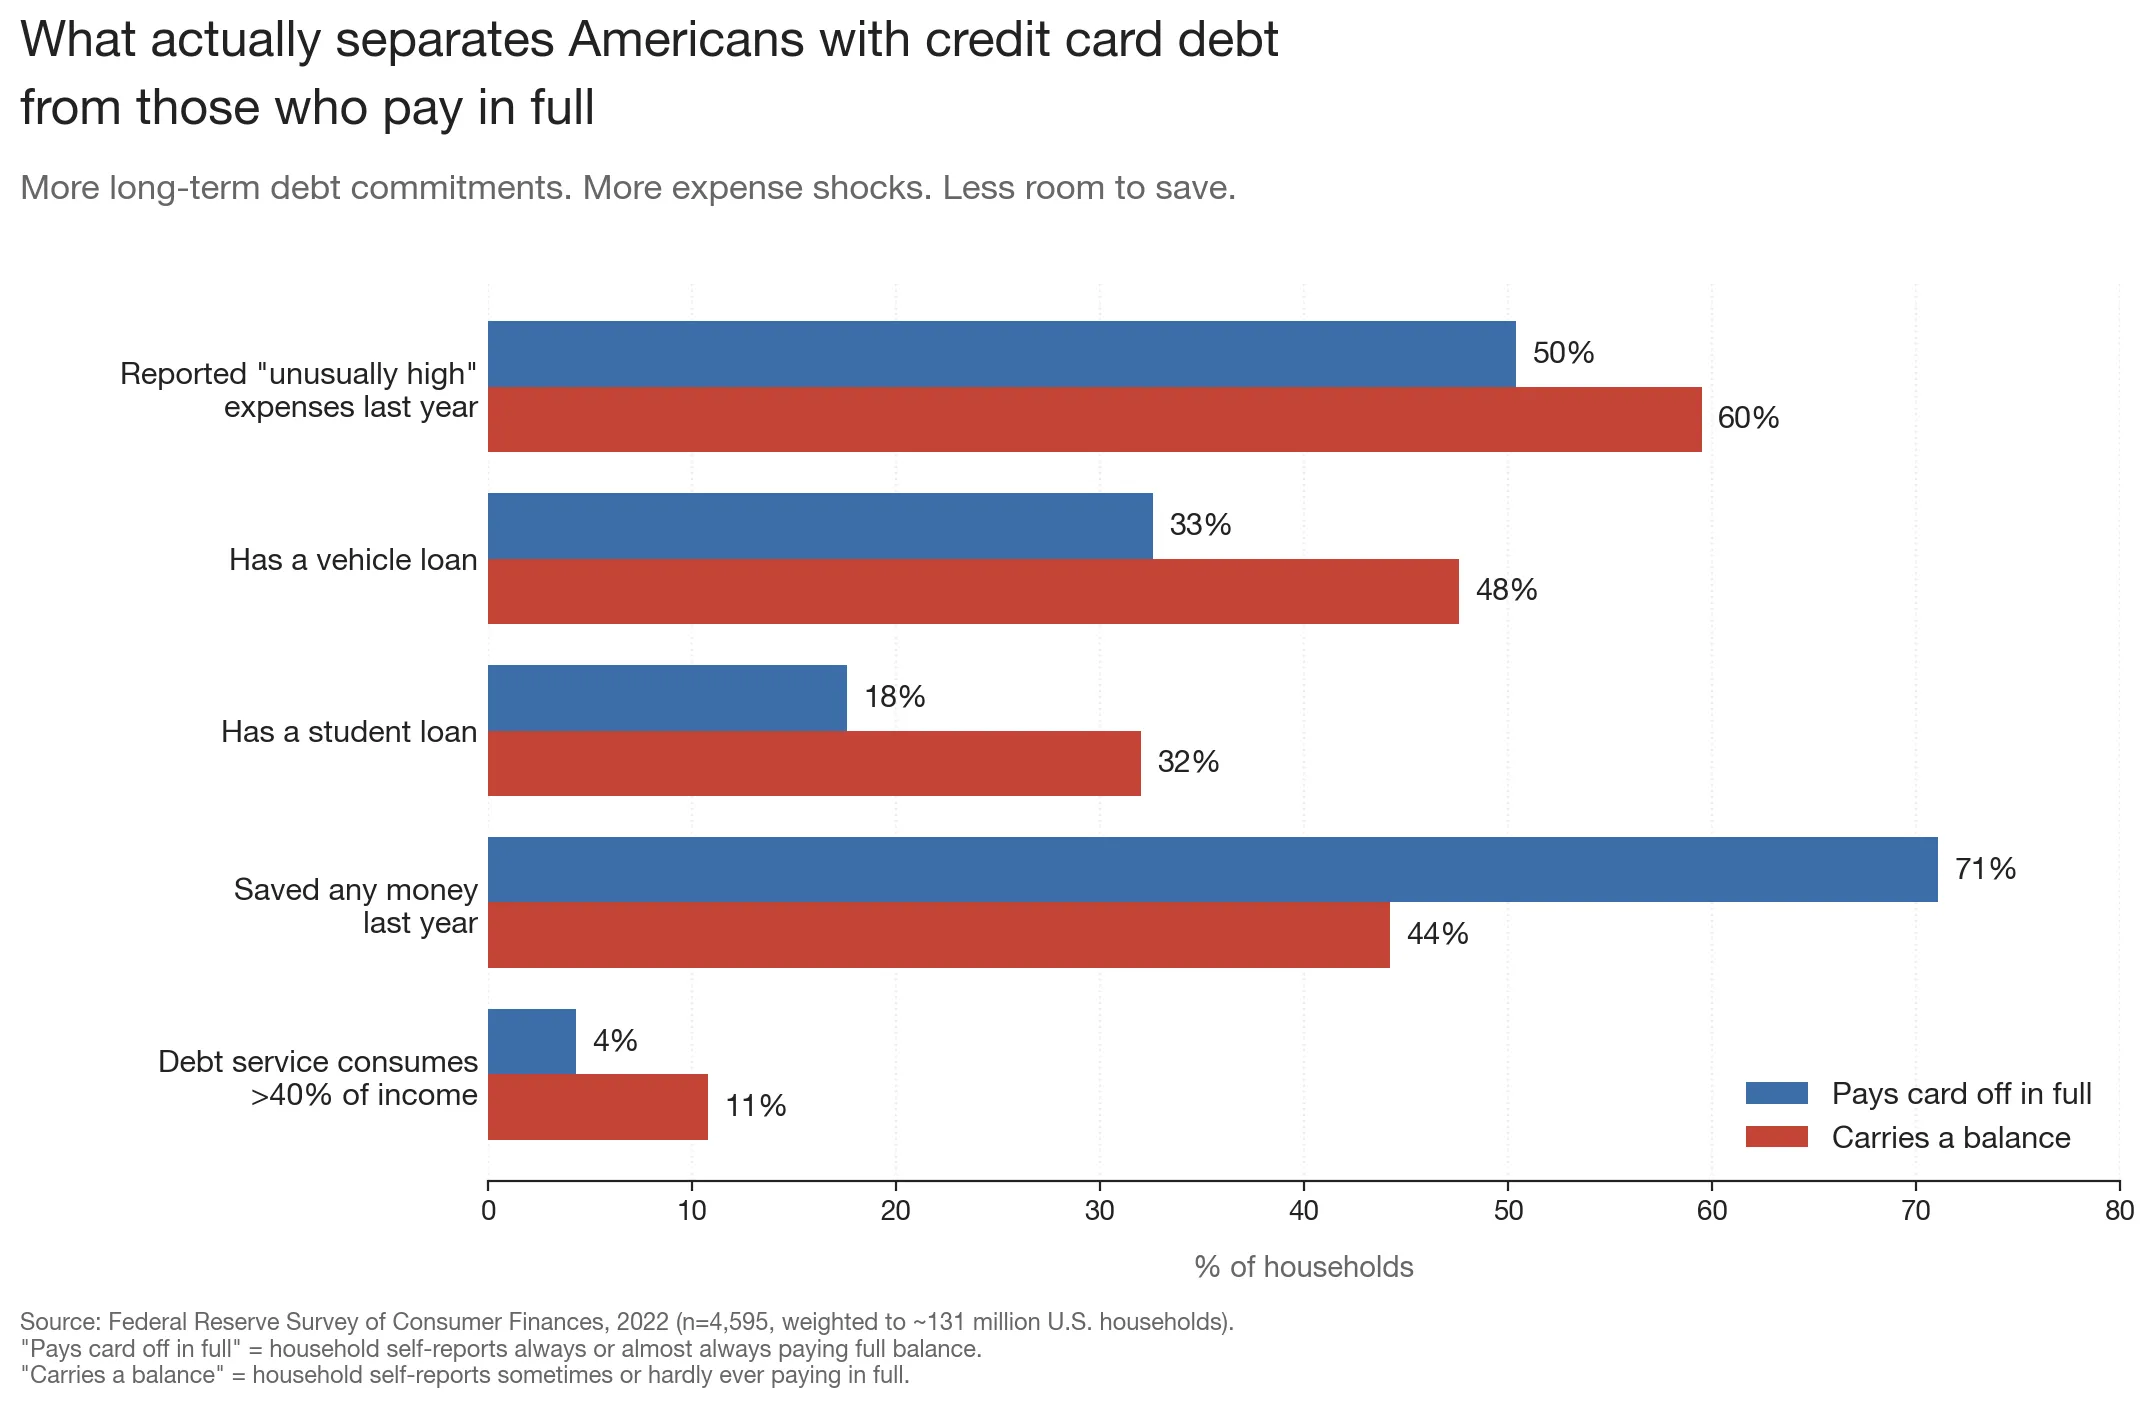
The credit card balance isn’t really where the debt lives. It’s just the visible part. The structural part is the auto loan and the student loan that were already there before the credit card balance ever started growing.
2. They hit more “unusual” years, and have less flex when they do
The Fed asks people whether their expenses last year were “unusually high, normal, or unusually low.” Sixty percent of revolvers say unusually high. Half of transactors say it too. But only half.
Now combine that with this:
- Only 44% of revolvers managed to save anything last year.
- Among transactors, it’s 71%.
So revolvers see slightly more “unusual” years and have far less ability to absorb them. The vet bill, the broken HVAC, the kid’s specialist appointment, the family wedding — most years include at least one. If you don’t have any spare income to flex against it, something has to absorb the cost. The card is what’s there. (For context on where every dollar actually goes across the U.S. income distribution, see how Americans spend money by income.)
3. The most surprising finding: revolvers save for the exact same things
Here’s the one I can’t stop thinking about.
The Federal Reserve asks people what they’re saving for, with options like retirement, emergencies, a home, education, family events. I expected revolvers to look meaningfully different. Maybe they prioritize “purchases” — vacations, cars — more. Maybe they don’t save for retirement. Maybe they have shorter time horizons.
They don’t:
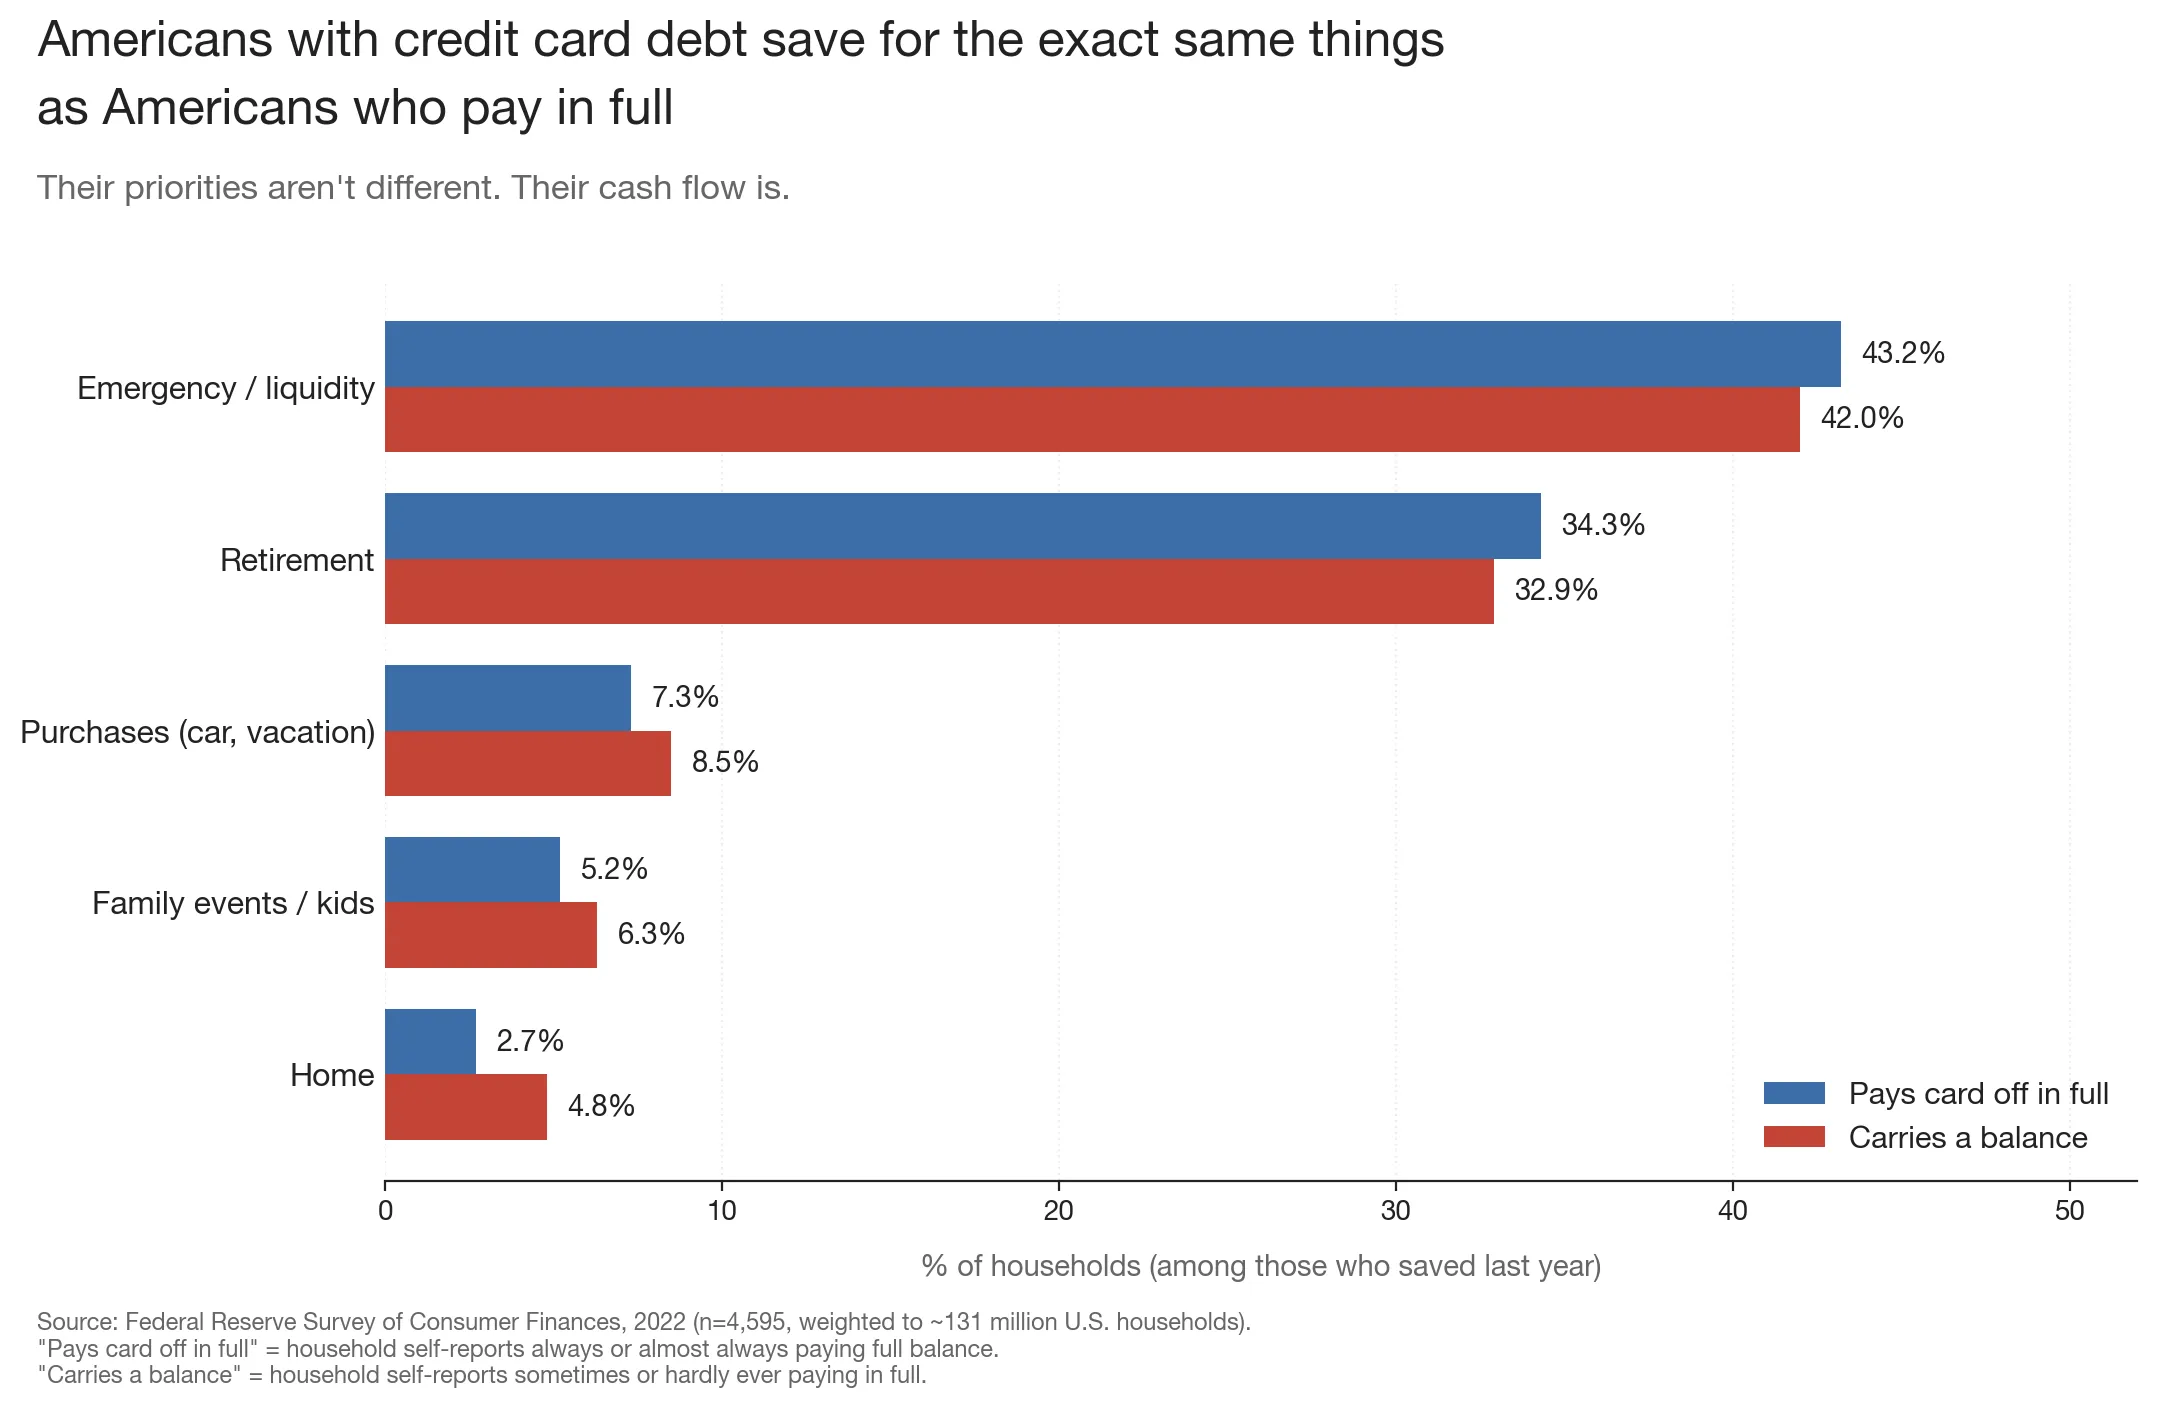
| What savers say they’re saving for | Transactors | Revolvers |
|---|---|---|
| Retirement | 34.3% | 32.9% |
| Emergency / liquidity | 43.2% | 42.0% |
| Home | 2.7% | 4.8% |
| Family events / kids | 5.2% | 6.3% |
| Purchases (car/vacation) | 7.3% | 8.5% |
The distributions are nearly identical. Revolvers prioritize retirement at the same rate. They prioritize emergency savings at the same rate. They want the same things.
They just save at half the rate — not because they’re saving for less worthy things, but because most of the money is already going somewhere by the time they get it.
The discipline gap a lot of us imagine — different priorities, different values — basically doesn’t exist in the data. The income-after-commitments gap absolutely does.
The pattern that ties it together
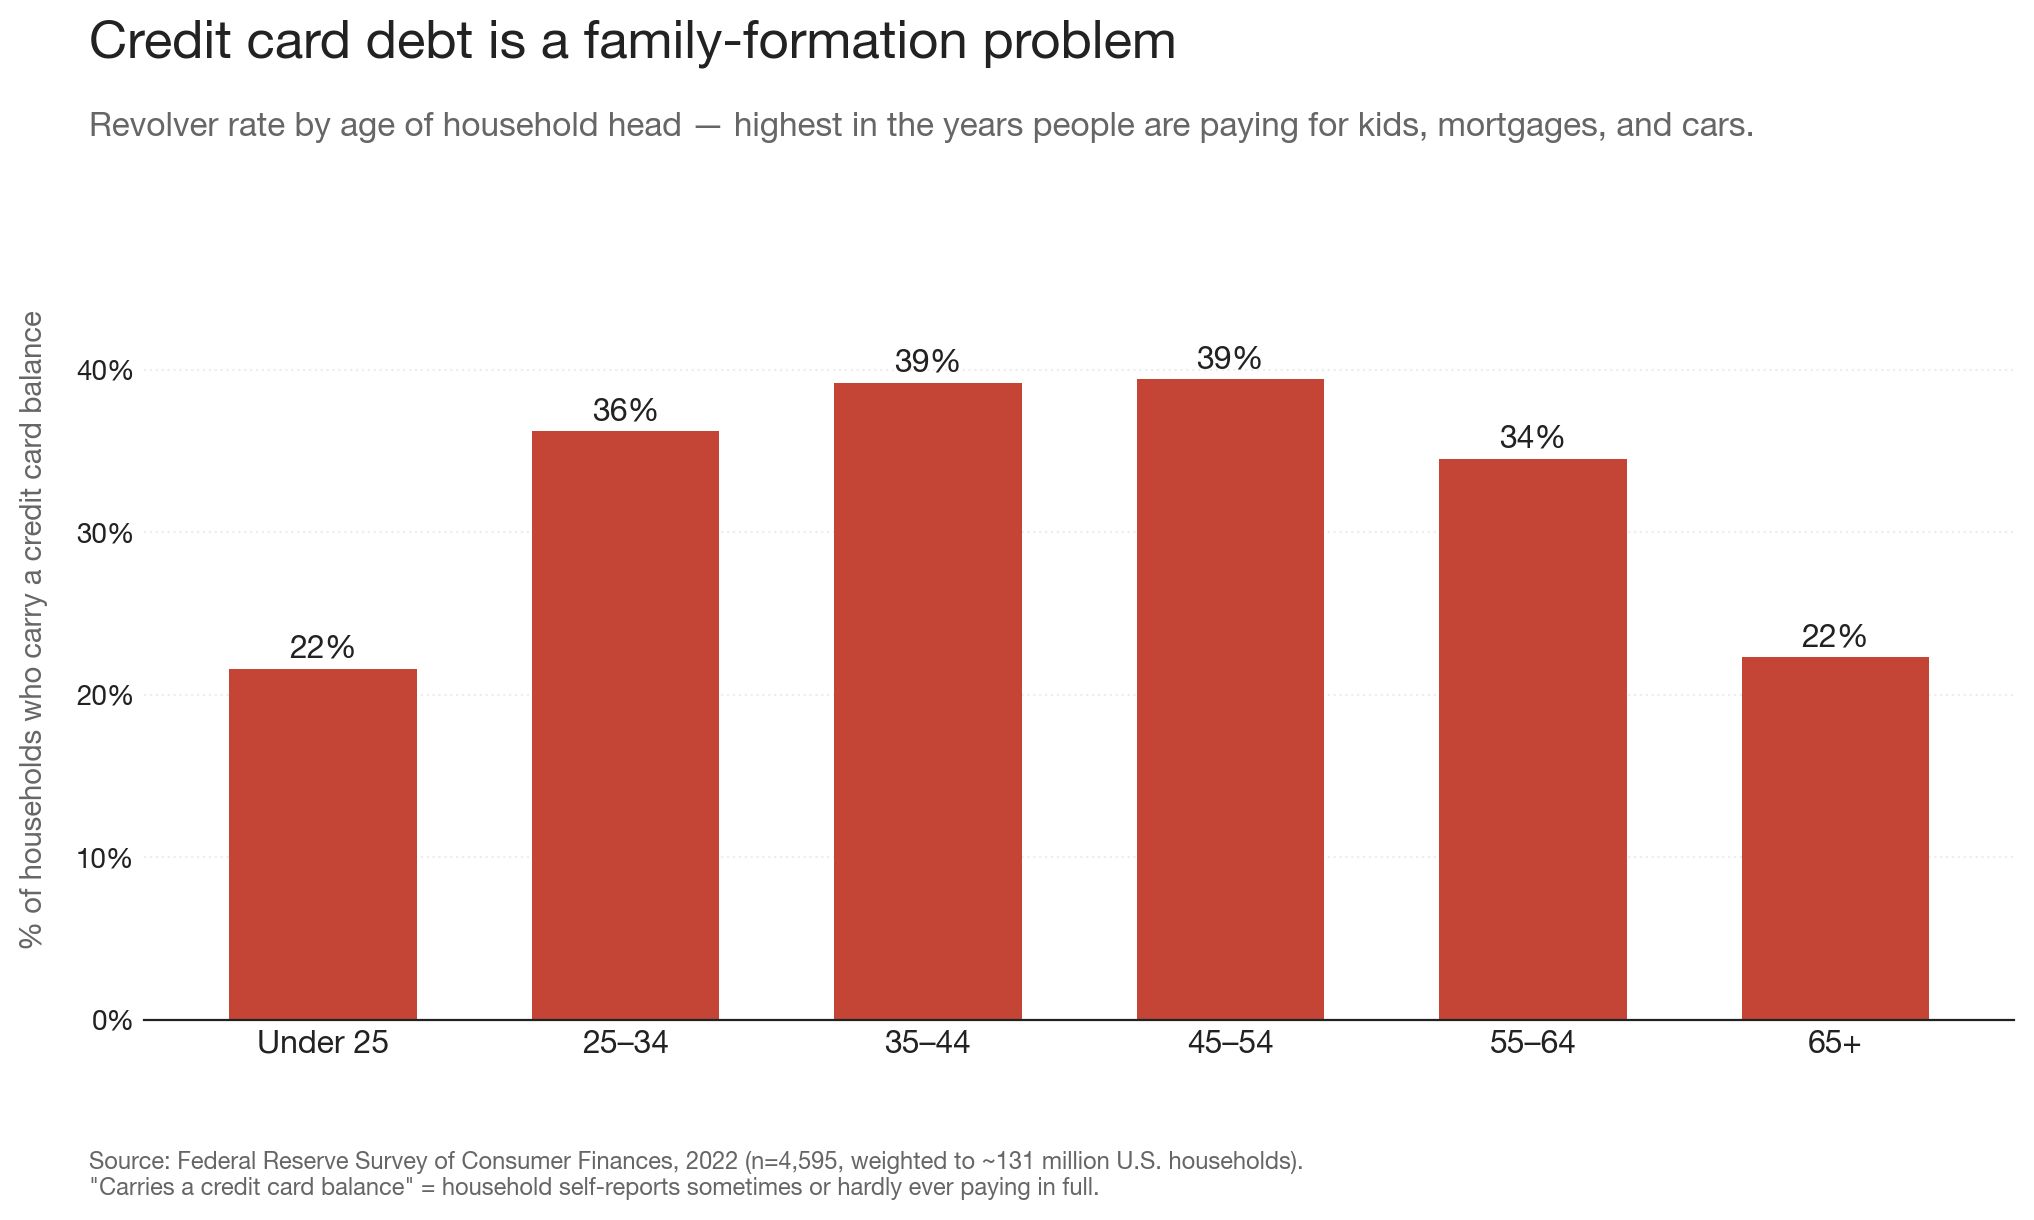
If you sort the revolver rate by age, this is the picture:

| Age | Revolver rate |
|---|---|
| Under 25 | 22% |
| 25-34 | 36% |
| 35-44 | 39% |
| 45-54 | 39% |
| 55-64 | 34% |
| 65+ | 22% |
And by kids in the household:
| Kids | Revolver rate |
|---|---|
| 0 | 27% |
| 1 | 41% |
| 2 | 40% |
| 3+ | 40% |
Revolver rate sits in the high 30s through prime working years, then drops at retirement. And having even one kid raises the revolver rate by about half — from 27% to 41%.
This is not a coincidence. What the data are telling you, when you put all the pieces together, is that revolving credit card debt is mostly a family-formation problem. The years you’re most likely to carry a balance are the years you’re paying for daycare, a mortgage, a car you need to get to your job, and probably still paying off your own education from a decade ago.
The mechanism, in four steps
Here’s the mechanism in four steps:
- Committing. Working-age people — especially those with kids — take on long-term commitments. Each one looks affordable in isolation. The car payment fits the budget. The mortgage fits the budget. The student loan was already there. Daycare is what it is.
- Stacking. The commitments stack until total debt reaches about 1x annual income — roughly twice what people who pay in full carry. Cash flow is now fully spoken for.
- The unusual year. Most years have something. Sixty percent are “unusually high.” With nothing left to flex, the unusual expense goes on the card.
- Compounding. Next year has its own unusual event. The balance never gets paid down. Years pass. The interest keeps running.
Notice what’s not in this list. Bad decisions. Lack of discipline. Not understanding interest rates.
I’m not saying individual choices don’t matter. They do. People could buy cheaper cars. They could rent longer before buying. They could have one fewer kid — though that’s a weird thing to lecture anyone about. The choices that put people on this path are real.
But the population that ends up with credit card debt isn’t separated from the population that pays in full by their choices about credit cards. They’re separated by their long-term commitments and how much cash flow flexibility those commitments leave behind. And those commitments — a car, a degree, a home, a kid — are choices that mostly happened years before any credit card balance started growing.
What this changes
Pretty much every personal finance app on the market is built around tracking. Mint, Monarch, Copilot, YNAB — they all show you, in beautifully designed detail, where your money went last month.
That’s a useful thing to know. It’s also not the thing the data say is actually missing.
What’s actually missing is something that shows you, before you sign the car loan, what the next five years of cash flow look like — accounting for the kid you’re planning to have, the mortgage you’re considering, and the inevitable unusual year. Tracking solved a problem most people don’t really have anymore. The remaining problem is forecasting: will the commitments I’m about to make leave any room for what I can’t predict?
I don’t think the data say people in credit card debt are blameless. I do think they say the cultural diagnosis is mostly wrong. The median American carrying a balance isn’t reckless. They’re committed.
The line between them and the people who pay in full isn’t discipline. It’s slack.
FAQ
How many Americans carry credit card debt? ▶
About 32% of U.S. households — roughly 43 million homes — report that they "sometimes" or "hardly ever" pay their credit card balance in full each month, per the Federal Reserve's 2022 Survey of Consumer Finances. About 50% pay in full almost every month, and about 18% have no credit card at all.
What is the median credit card balance for Americans who carry debt? ▶
The median household that revolves credit card debt carries about $3,500 on their cards after the most recent payment. They also have about $3,900 in liquid savings — meaning the median revolver could pay off the balance in cash today and have a few hundred dollars left over.
Why do people carry credit card debt if they have savings? ▶
Because the savings are committed. Revolvers carry roughly twice as much total debt as a multiple of income than people who pay in full — most of it in long-term installment obligations like car loans and student loans. Their cash flow is fully spoken for before "unusual" expenses (vet bills, car repairs, medical bills) hit. The credit card absorbs the gap.
What's the average income of households with credit card debt? ▶
The median household that carries a credit card balance earns about $71,000 a year. That's below the U.S. median household income (~$83,700 in 2024) but well within what most people consider middle class. Households that pay in full earn a median of about $101,000.
Is credit card debt caused by financial illiteracy? ▶
The data don't support that. Even among households who score perfectly on the Federal Reserve's financial literacy quiz, 42% still carry a credit card balance. Knowledge moves the dial on acute financial distress (emergency fragility), but it barely touches the chronic habit of revolving debt. The bottleneck is committed cash flow, not knowledge.
Which age group is most likely to carry credit card debt? ▶
Households where the head is 35–54 years old. The revolver rate sits at 39% in the 35–44 and 45–54 brackets, then drops to 22% at age 65+. Having even one child in the household raises the revolver rate from 27% to 41%. Credit card debt is concentrated in the family-formation years.
Related Tools
- Debt Percentile Calculator — see how your credit card, student loan, and auto loan debt compares to U.S. households at your age and income.
- Net Worth Percentile Calculator — see where your net worth ranks against U.S. households by age.
- Income Percentile Calculator — find where your household income ranks nationally and in your state, county, or ZIP.
- Spending Breakdown — see how the typical American household at your income spends every dollar.
Related Articles
- How a $500/Month Car Payment Actually Affects Your Retirement Date — the long-term opportunity cost of a single committed expense.
- How Americans Spend Money by Income — BLS data on where every dollar goes across all 10 income deciles.
- Americans Who Answer 3 Basic Finance Questions Correctly Have 12x the Net Worth — the literacy gap is real, but it doesn’t show up where most people think it does.
- How to Stop Overspending — the structural fix when discipline alone isn’t the answer.
Source: Federal Reserve Survey of Consumer Finances 2022, full microdata (p22i6.dta) merged with the public summary extract. “Revolver” defined using SCF question x432 — households who report they “sometimes” or “hardly ever” pay their credit card balance in full. n = 4,595 households across all 5 imputation implicates, weighted to ~131M US households. Point estimates use Rubin’s rules to combine across implicates; standard errors and 95% confidence intervals computed using the SCF’s 999 bootstrap replicate weights applied to the first implicate. All headline statistics in this post are stable to within ±1.5 percentage points at the 95% confidence level — the underlying patterns are not artifacts of a single subsample.