Americans Who Answer 3 Basic Finance Questions Correctly Have 12x the Net Worth

The median net worth of Americans who score 3 out of 3 on a basic financial literacy test is $412,678. For those who score 0 out of 3, it’s $32,672. That’s a 12.6x gap.
You might assume income explains the difference. It doesn’t. Even among Americans in the same income bracket, those who answer all three questions correctly have dramatically more wealth than those who can’t.
We dug into the Federal Reserve’s 2022 Survey of Consumer Finances (SCF) to see exactly how wide this gap is, and whether it holds up when you control for income, education, and age. It does.
The 3 Questions
The SCF includes three financial literacy questions developed by economists Annamaria Lusardi and Olivia Mitchell. They test understanding of compound interest, inflation, and risk diversification. Here they are:
1. Compound interest: Suppose you had $100 in a savings account and the interest rate was 2% per year. After 5 years, how much do you think you would have if you left the money to grow: more than $102, exactly $102, or less than $102?
2. Inflation: Imagine the interest rate on your savings account was 1% per year and inflation was 2% per year. After 1 year, would you be able to buy more than today, exactly the same, or less than today?
3. Risk diversification: True or false: buying a single company’s stock usually provides a safer return than a stock mutual fund.
The correct answers are: more than $102, less than today, and false. 44.2% of U.S. households get all three right. 2.9% get none right. 15.6% get one right. 37.3% get two right.
The Wealth Gap by Score
| Financial Literacy Score | Median Net Worth | % of U.S. Households |
|---|---|---|
| 0 out of 3 | $32,672 | 2.9% |
| 1 out of 3 | $53,706 | 15.6% |
| 2 out of 3 | $136,961 | 37.3% |
| 3 out of 3 | $412,678 | 44.2% |
Each additional correct answer correlates with roughly double the median net worth. From 0 to 3, the cumulative gap is 12.6x.
Curious where your net worth ranks? Check with our Net Worth Percentile Calculator, built on the same Federal Reserve data.
”But They Probably Earn More”
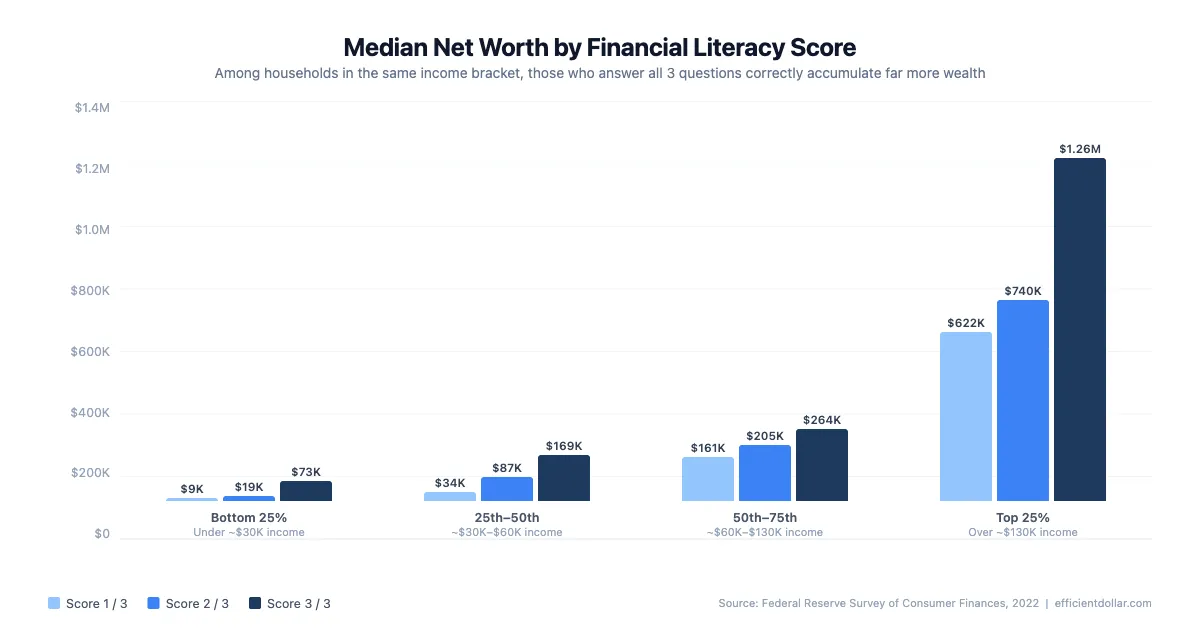
The obvious objection: financially literate people probably have higher incomes, and income drives wealth. So we split the data by income quartile and ran the same analysis.
| Income Quartile | Score 1/3 | Score 2/3 | Score 3/3 |
|---|---|---|---|
| Bottom 25% (under ~$30K) | $9,262 | $18,568 | $73,460 |
| 25th-50th (~$30K-$60K) | $33,984 | $87,000 | $168,980 |
| 50th-75th (~$60K-$130K) | $160,736 | $204,712 | $264,420 |
| Top 25% (over ~$130K) | $621,534 | $740,140 | $1,262,938 |
Median net worth by financial literacy score within each income quartile. Score 0/3 excluded from table due to small sample sizes within quartiles (2.9% of all households).
The pattern holds at every income level. Among the bottom 25% of earners, those who score 3/3 have a median net worth of $73,460 compared to $9,262 for those who score 1/3. That’s a 7.9x gap between households earning roughly the same amount.
Among top-quartile earners, the gap is still 2.0x: $1,262,938 for perfect scorers versus $621,534 for those who get one right.
Income alone doesn’t explain this. Something else is going on.
“But They Probably Went to Better Schools”
We controlled for education too.
| Education Level | Score 1/3 | Score 2/3 | Score 3/3 |
|---|---|---|---|
| High school diploma | $42,300 | $104,840 | $220,202 |
| Some college | $63,232 | $107,542 | $266,782 |
| College degree | $86,928 | $311,760 | $718,550 |
Among college graduates who score 3/3, the median net worth is $718,550. College graduates who score 1/3 have $86,928. Same diploma, 8.3x gap.
Among those with only a high school diploma, the 3/3 group has $220,202 versus $42,300 for the 1/3 group. A 5.2x gap.
Financial literacy appears to compound on top of education rather than merely reflecting it.
What Financially Literate People Do Differently
The SCF also tracks financial behaviors, and the data shows clear differences between high- and low-scoring households.
| Behavior | Score 0/3 | Score 1/3 | Score 2/3 | Score 3/3 |
|---|---|---|---|---|
| Owns stocks directly | 4.3% | 8.0% | 15.3% | 31.5% |
| Spent less than income | 48.7% | 42.8% | 52.9% | 65.0% |
| Owns a home | 76.3% | 78.6% | 85.4% | 90.4% |
| Has $0 in retirement accounts | 71.7% | 69.1% | 53.9% | 28.6% |
People who understand compound interest, inflation, and diversification are 7.3x more likely to own stocks, 22 percentage points more likely to spend less than they earn, and 2.5x less likely to have zero retirement savings.
These behavioral differences help explain the wealth gap. Stock ownership in particular has enormous compounding effects over decades. Only 4.3% of those who score 0/3 own any stocks at all, compared to 31.5% of perfect scorers.
The Gap Persists at Every Age
| Age Group | Low Literacy (0-1) Median NW | High Literacy (2-3) Median NW | Gap |
|---|---|---|---|
| Under 35 | $6,898 | $58,619 | 8.5x |
| 35-44 | $27,162 | $174,900 | 6.4x |
| 45-54 | $43,168 | $300,450 | 7.0x |
| 55-64 | $141,830 | $404,780 | 2.9x |
| 65-74 | $97,486 | $500,556 | 5.1x |
| 75+ | $101,210 | $425,840 | 4.2x |
The gap is widest for young adults. Americans under 35 with high financial literacy have 8.5x the median net worth of those with low literacy. By 55-64, the gap narrows to 2.9x (possibly because those with low literacy who survive financially to that age have accumulated some housing equity).
What This Means for Millionaires
The millionaire breakdown is stark. Among U.S. households with $1 million or more in net worth:
- 70.9% score 3 out of 3
- 22.8% score 2 out of 3
- 5.1% score 1 out of 3
- 1.2% score 0 out of 3
93.7% of millionaire households answer at least 2 of the 3 questions correctly.
Correlation, Not Causation
This data shows a strong correlation. It does not prove that answering three questions correctly causes wealth accumulation.
The relationship likely runs in both directions. People who understand finance make better decisions about saving, investing, and debt, which builds wealth. People with more wealth also have more reason and opportunity to learn about finance.
That said, the income-controlled analysis is hard to dismiss. Among households earning the same amount, those who understand compound interest, inflation, and diversification accumulate dramatically more wealth over time. Academic research by Lusardi, Mitchell, and others estimates that financial literacy explains 30-40% of wealth inequality among pre-retirees, even after controlling for other factors.
Three concepts. Not three degrees or three promotions. Three concepts.
Where Do You Stand?
If you’re curious where your net worth falls relative to other Americans (and your age group), use the Net Worth Percentile Calculator. It uses the same Federal Reserve SCF data analyzed here.
Related: BLS data tells the other side of this story. The bottom 40% of U.S. households spend more than they earn — and the spending patterns across income deciles reveal why financial awareness makes such a difference.
Related: financial literacy isn’t the only “obvious” explanation that doesn’t hold up. Americans with credit card debt save for the same things as people who pay in full — even households who score perfectly on the SCF financial literacy quiz still carry a balance 42% of the time. Knowledge moves the dial on acute distress, but not on chronic debt.
Methodology
Data comes from the Federal Reserve’s 2022 Survey of Consumer Finances (SCF), the most comprehensive survey of household finances in the United States. The survey was conducted from February 2022 through April 2023 and includes 4,602 families across 5 implicates (statistical replicates). All percentile figures in this analysis are averaged across all 5 implicates using the survey’s population weights.
Financial literacy is measured by the FINLIT variable, a 0-3 score based on correct answers to the Lusardi-Mitchell “Big Three” questions about compound interest, inflation, and risk diversification. Income quartile cutoffs and net worth percentiles are computed independently within each implicate, then averaged.
The SCF oversamples wealthy households by design, so the sample is not a simple random draw. All analysis uses the provided survey weights (WGT) to produce nationally representative estimates. The “median” figures reported are weighted medians.
One limitation: the SCF samples households (family units), not individuals. The financial literacy score reflects the respondent (typically the household’s financially most knowledgeable person), which may not capture the financial literacy of all household members.
Newsletter
Want more research like this?
Original research on personal finance and economics, sent to your inbox monthly.