How Americans Actually Build Wealth — And Why the Path Forks at $1 Million

The Federal Reserve’s 2022 Survey of Consumer Finances answers a deceptively simple question.
Where does America’s wealth actually live?
Not how much there is. Not who has it. Just the dollars themselves — what buckets are they sitting in?
The answer changes so dramatically across wealth tiers that the path up isn’t really a savings problem. It’s structural.
Here’s the headline.
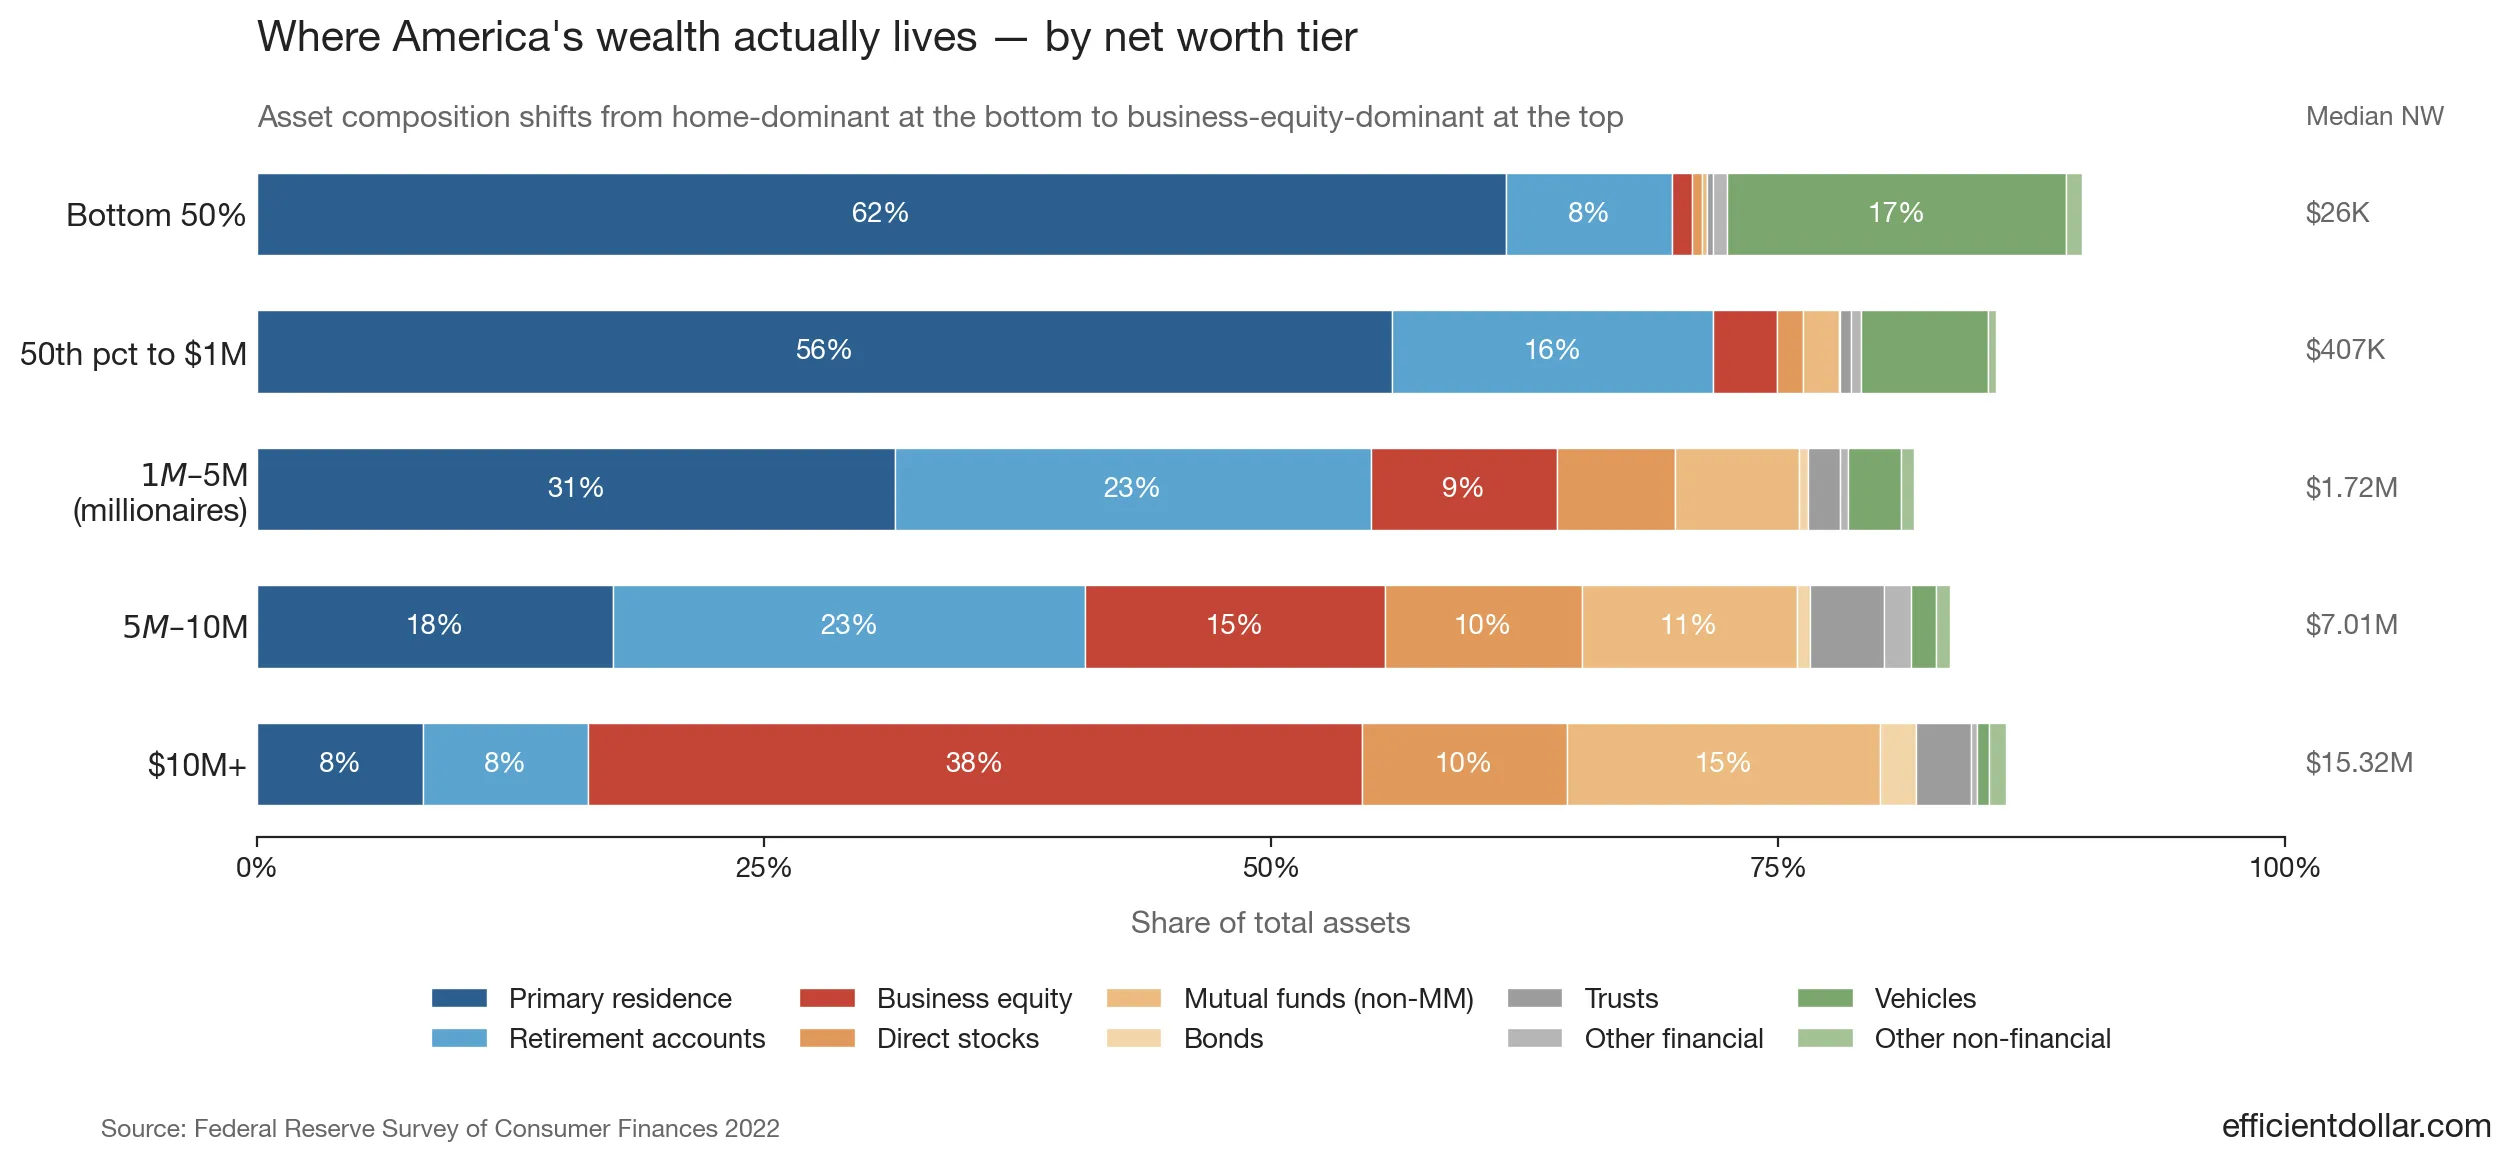
| Tier | Median net worth | Wealth in home | Wealth in retirement accounts | Wealth in business equity |
|---|---|---|---|---|
| Bottom 50% | $26K | 61.6% | 8.2% | 1.0% |
| 50th pct → $1M | $407K | 56.0% | 15.8% | 3.2% |
| Millionaire ($1M–$5M) | $1.72M | 31.4% | 23.5% | 9.2% |
| $5M–$10M | $7.01M | 17.5% | 23.3% | 14.8% |
| $10M+ | $15.32M | 8.2% | 8.1% | 38.2% |
A bottom-50% household has 62% of its assets locked up in their home. A $10M+ household has 8%.
A bottom-50% household has 1% in business equity. A $10M+ household has 38%.
The wealth at the top isn’t a scaled-up version of the wealth in the middle. It’s a structurally different thing.
For dollar context, the SCF’s 2022 distribution puts the median household net worth at $192K, the 90th percentile at $1.92M, and the 99th percentile at $13.67M. So in 2022, “top 10%” already meant millionaire-and-then-some. “Top 1%” meant roughly $14M.
The lifecycle: most Americans’ wealth is the house
Before tiers, the cross-section by age tells its own story.
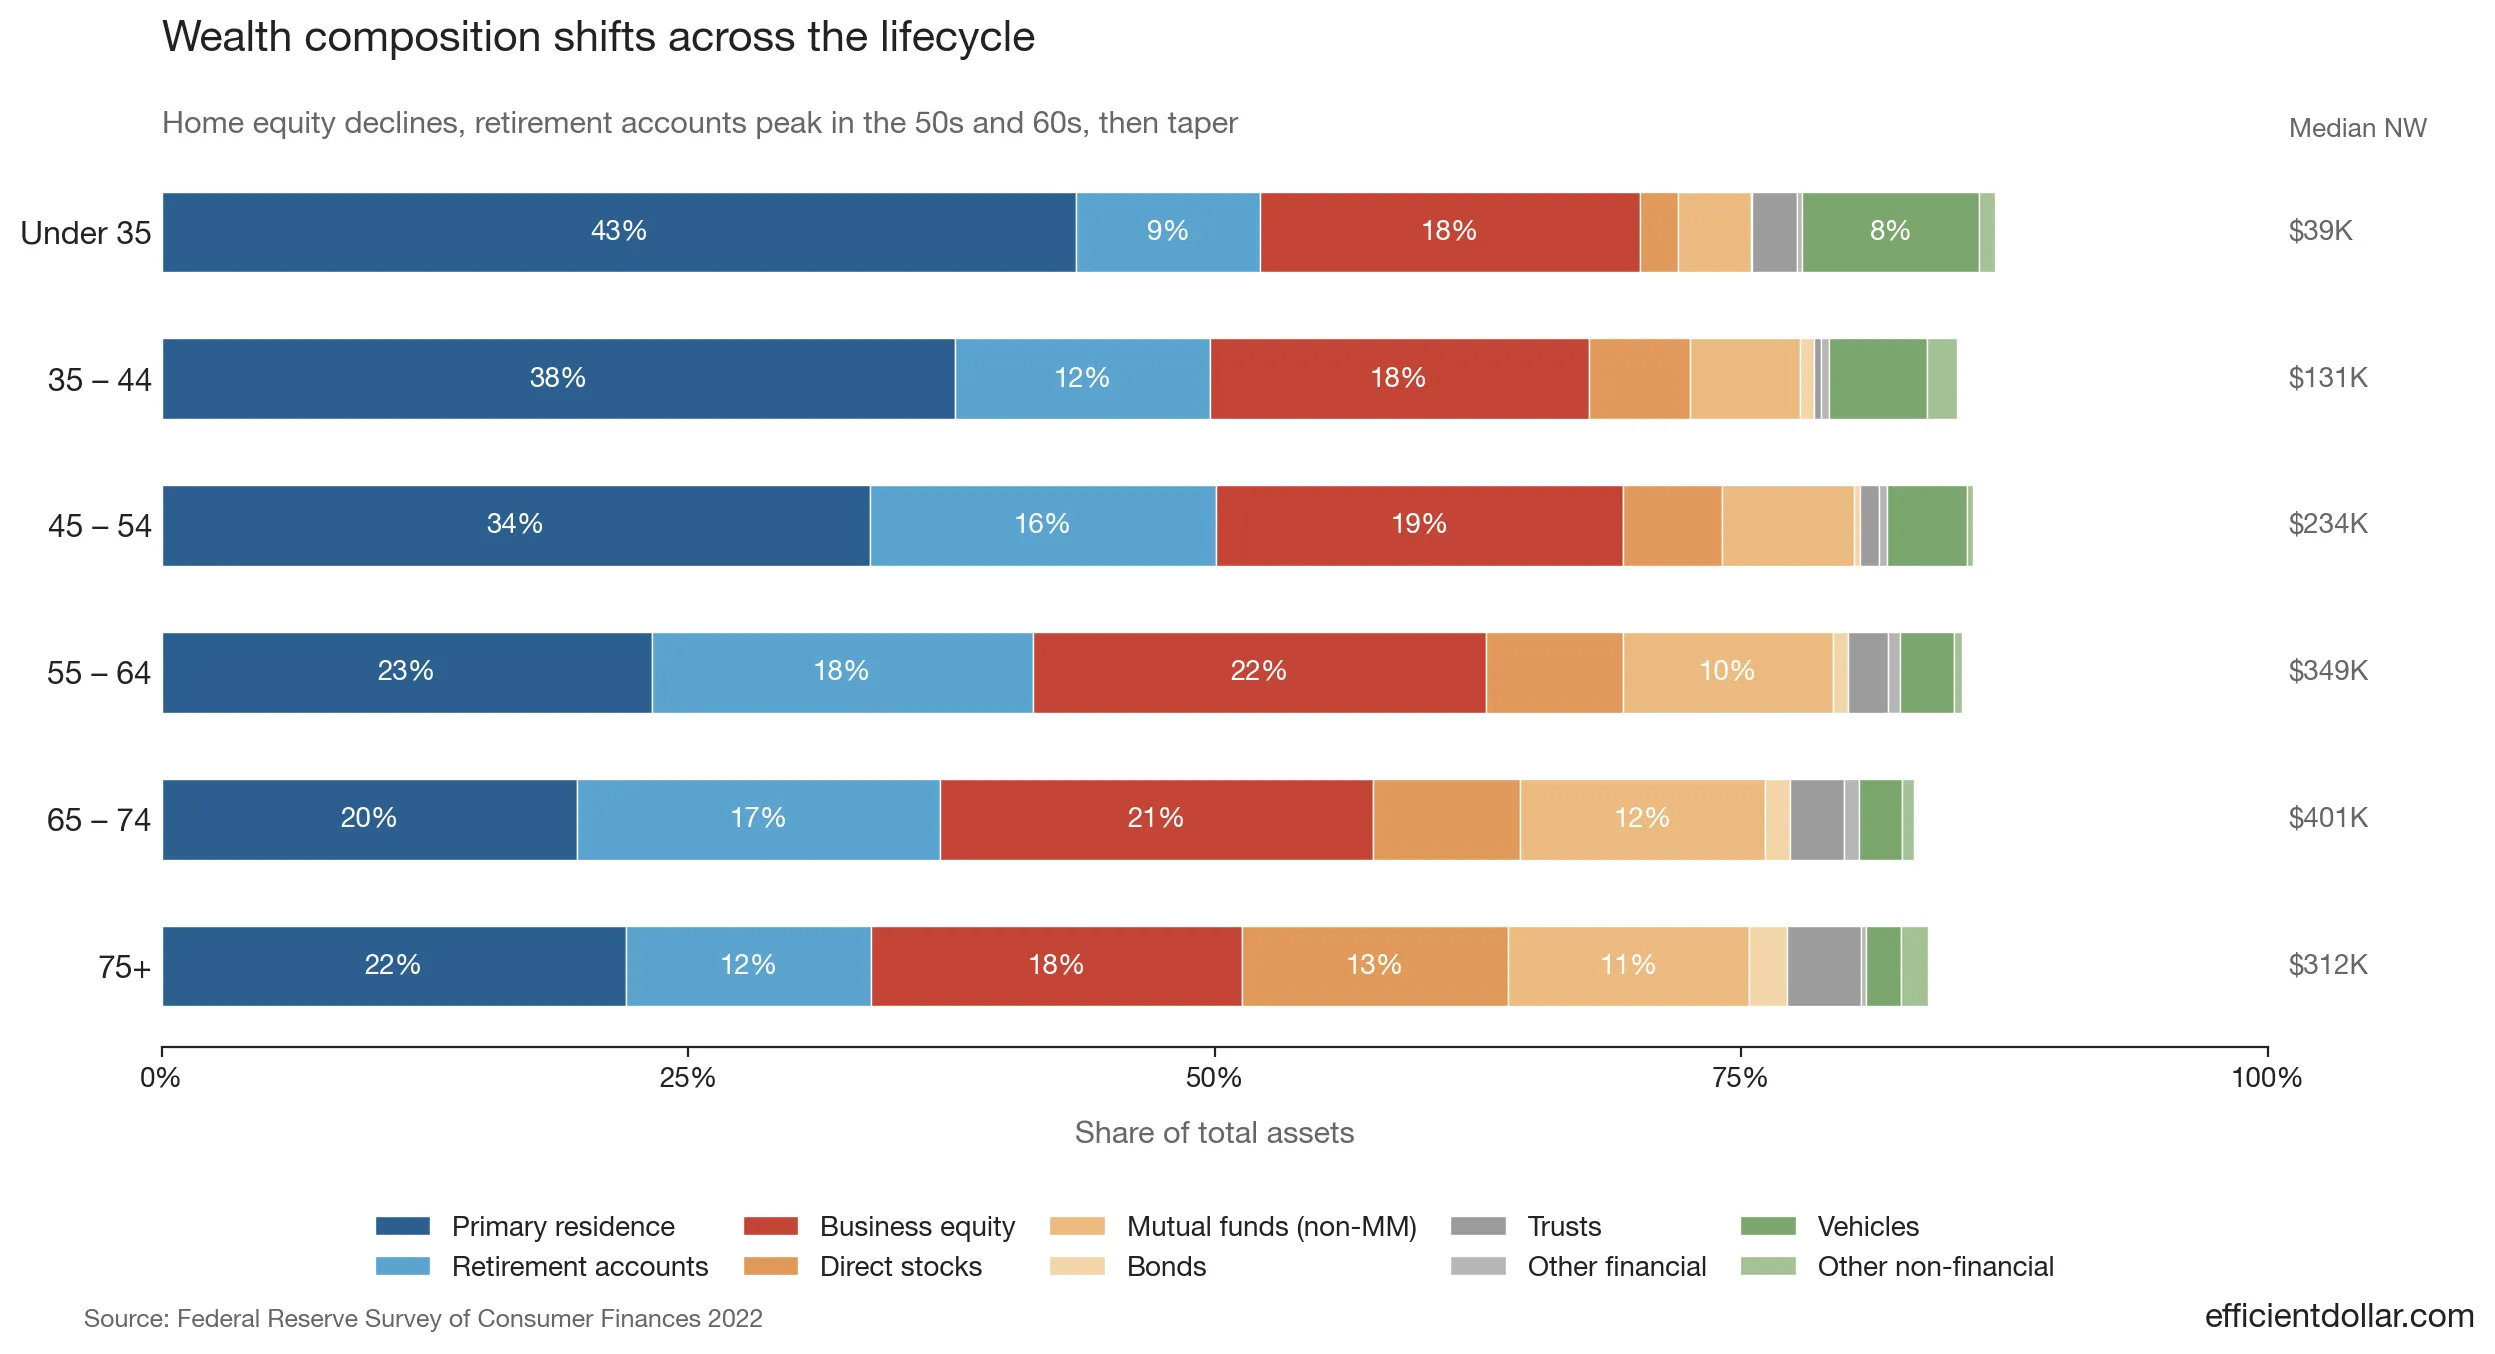
| Age cohort | Home equity share of assets | Retirement accounts | Median net worth |
|---|---|---|---|
| Under 35 | 43.4% | 8.7% | $39K |
| 35–44 | 37.7% | 12.1% | $131K |
| 45–54 | 33.6% | 16.4% | $234K |
| 55–64 | 23.3% | 18.1% | $349K |
| 65–74 | 19.7% | 17.2% | $401K |
| 75+ | 22.1% | 11.6% | $312K |
A few things to notice.
The home share falls as people age. Not because they’re getting out of housing — it’s that everything else grows faster. Retirement accounts compound. Investment accounts compound. By 65, the median household has paid off the mortgage and has $400K of net worth, but home equity is a smaller proportion of it because the rest of the portfolio caught up.
Retirement accounts peak in your 50s and 60s, then drop. Some of that’s drawdown. Some of it’s that very wealthy 75+ households have already maxed out their tax-advantaged accounts and overflow into taxable equities.
The median 65–74 household has $411K in net worth. About 17% of that is in retirement accounts. That’s roughly $70K. The rest is mostly home equity, vehicles, and a small mutual-fund balance.
I’ll come back to that number. $70K. The median 65–74-year-old’s retirement account balance is not exactly the headline figure of the financial-planning industry.
This is the median path — and the median path stops well short of millionaire territory.
The fork at $1 million
Crossing the millionaire threshold requires more than just continuing the median path. The structure of wealth changes.
Look at what’s in a millionaire’s balance sheet ($1M–$5M tier):
- Primary residence: 31.4%. The home is roughly half the share it was for the bottom 50%.
- Retirement accounts: 23.5%. Three times the share of the median household.
- Business equity: 9.2%. Nearly ten times the share of the median household.
- Mutual funds + direct stocks + bonds: 12.4% combined.
- Vehicles drop from 17% (bottom 50%) to 2.6%.
The path from bottom-50% to millionaire isn’t “they bought a bigger house.” It’s that everything else got built up around the house. The home went from being almost the entire balance sheet to being one of several comparable assets.
This is the disciplined-saver path. Roughly 23% of a millionaire’s wealth is in retirement accounts, built over decades of payroll deferrals, employer matches, and tax-deferred compounding. Another 12% is in taxable investments. About 9% is in a side business or partial interest.
You can think of this as the “max-the-401(k)-and-let-it-cook” path. It’s mostly a savings-rate-and-time problem. There’s a clear playbook. It works.
But there’s a ceiling on this path, and the data shows you exactly where.
At $10M+, the structure breaks
Look at what happens at the top tier.
- Primary residence: 8.2%. The home is now a rounding error.
- Retirement accounts: 8.1%. 401(k)s and IRAs are also a rounding error.
- Business equity: 38.2%. Almost half the wealth, sitting in a privately held business.
- Mutual funds + direct stocks + trusts: 28.2%.
The shift from millionaire to $10M+ isn’t more savings. Retirement-account share drops from 23.5% to 8.1%. Home share drops from 31% to 8%. What grows explosively is business equity, from 9.2% to 38.2%.
This isn’t a “save 25% of your income for 40 years” outcome. There is no payroll deferral that produces a 38% concentration in private business equity. That category captures the value of a company you founded, a partnership you bought into, equity in a privately held firm. It’s the asset of owners.
The data is showing two distinct paths up the wealth ladder.
Path A (median millionaire): your salary, your savings rate, your time horizon, and the public-markets compound machine. This gets a disciplined two-earner household to $1M–$5M by retirement. The best version lands somewhere in the lower-millionaire tier.
Path B (the $10M+ household): partial or full ownership of a productive enterprise. The wealth comes not from accumulating securities but from capitalizing future cash flows of a business you own.
You can do both at once. Most $10M+ households are running both — they have business equity and retirement accounts and taxable portfolios. But the dominant share of their wealth is the business stake.
Retirement accounts have a ceiling. IRS contribution limits cap how much can flow into them. A 40-year career maxing out a 401(k) tops out somewhere around $3M–$5M in today’s dollars under reasonable return assumptions. That’s the millionaire tier. Past that, the wealth has to come from somewhere else.
A reality check on the retirement-account path
Vanguard’s How America Saves 2025 tracks roughly 5 million 401(k) participants. The median balance at every age:
| Age cohort | Median 401(k) balance (Vanguard, 2024) |
|---|---|
| <25 | $1,948 |
| 25–34 | $16,255 |
| 35–44 | $39,958 |
| 45–54 | $67,796 |
| 55–64 | $95,642 |
| 65+ | $95,425 |
These are active 401(k) participants. They’re already in a plan. (The 18% of US workers without access to one are not even in this distribution.) Even at peak savings age, the median balance is under $100K.
The average is much higher: $271K at age 55–64. A small number of long-tenured, high-saving accounts pull the average up. Vanguard says average balances are roughly the 75th percentile of participants. Half of all participants have less than the median.
If you’re saving aggressively and consistently, you can be in the top quartile of 401(k) balances and still have under $250K at retirement. To break $1M in your 401(k), the threshold that would matter for landing in the millionaire wealth tier from this asset alone, you need to be in roughly the top 10% of 401(k) savers.
Vanguard also shows the savings rates that produce these balances. The median deferral rate is 6.8% of pay. Including the average employer match (4.6%), the median total contribution rate is 11.5%. That’s roughly half of Vanguard’s recommended 12–15% target. About 14% of participants reach the IRS contribution limit each year. Those are the maxers, the people on the path.
The math is brutal but defensible. 11.5% of a typical $90K career, compounded across 35 years at typical 60/40 portfolio returns, lands in the $400K–$900K range at retirement. That’s the median path. Breaking $1M in retirement accounts alone requires a higher savings rate, higher income, longer tenure, or some mix.
When SCF says the median 65–74 household has $70K in retirement accounts, and Vanguard says the median 55–64 active 401(k) participant has $95K, these numbers are roughly consistent. Most Americans aren’t failing. They’re exactly where 11.5% career-long savings produces.
What about retirement accounts at $10M+?
The dollar amount in retirement accounts is roughly the same at $10M+ as at $1M–$5M. Often higher.
What’s striking is the share:
| Tier | Median NW | Retirement accounts as % of assets |
|---|---|---|
| Millionaire ($1M–$5M) | $1.72M | 23.5% |
| $5M–$10M | $7.01M | 23.3% |
| $10M+ | $15.32M | 8.1% |
At the millionaire tier, retirement accounts are about a quarter of the balance sheet. A load-bearing wall. At $10M+, the share is a third of that. The retirement engine didn’t slow down. The rest of the wealth just pulled away from it.
A few practical implications:
- You can’t out-save your way to the very top tier. The contribution limits won’t let you. You can out-save your way to the bottom of the millionaire tier.
- At the very top, retirement accounts are an afterthought. The wealth is in the business and in taxable investments.
- Crossing into the top tier means changing the kind of asset you accumulate. Different decisions, different time horizons, different risks.
Most millionaires are professionals, not entrepreneurs
The Federal Reserve’s data lets you cross-tab millionaire status by occupation category. Here’s what it shows for working-age (under 65) Americans.
| Occupation category | Share of millionaires under 65 | Share of all working-age households | Representation |
|---|---|---|---|
| Managerial / Professional | 65.7% | 73.4% | 0.9× (slightly under) |
| Technical / Sales / Services | 23.6% | 11.4% | 2.1× (strongly over) |
| Other (production, construction, trades, farming) | 8.3% | 9.8% | 0.8× (slightly under) |
| Not working | 2.4% | 5.4% | 0.4× (strongly under) |
The right column is share-of-millionaires divided by share-of-population. 1.0× means proportionally represented. Above 1.0× means over-represented in the millionaire population.
A few things stand out.
The “Managerial / Professional” category, which most people associate with wealth, is actually slightly under-represented among millionaires (0.9×). The category that’s over-represented by far is Technical / Sales / Services, at 2.1× the population rate. That bucket includes commissioned salespeople, real-estate agents, financial advisors, and skilled-trade operators running their own books. Careers where pay scales with output rather than salary band.
This is consistent with what other surveys have found. Ramsey’s 2017 “Everyday Millionaires” study, which surveyed 10,000 American millionaires, reported the top five occupations as engineer, accountant, teacher, manager, and attorney. None of those are wildly high-paying career arcs on their own. The path was income consistency plus savings discipline plus time.
Most millionaires aren’t entrepreneurs. They’re disciplined professionals. The kind of person whose career involves a stable paycheck for 35 years.
This points back to Path A. The biggest population of millionaires got there by saving consistently for decades. Dentists, engineers, actuaries, accountants, senior managers, schoolteacher-married-to-an-engineer households. Two-earner households with stable jobs and 25%+ savings rates land in the millionaire tier by their late 50s, almost regardless of starting income.
What about inheritance? The 2022 SCF analysis finds that 26% of US households have ever received an inheritance, gift, or transfer. The median inheritance amount among recipients is roughly $70K (in 2022 dollars). The Federal Reserve estimates inherited wealth accounts for less than 20% of total household wealth in the US.
For the millionaire tier specifically, the long-running finding from “The Millionaire Next Door” and subsequent surveys is that roughly 80% of US millionaires are first-generation rich, meaning their parents were not millionaires. Inheritance is a tailwind for some, a non-event for most.
Most American millionaires built their wealth themselves over a 30–40-year career, and the dominant lever was savings rate, not income. The “they all inherited it” framing isn’t supported by the data.
So how often does anyone actually move up?
The SCF is a snapshot. It tells you where households are today, not how they got there. It doesn’t tell you whether the wealthy 65-year-olds you see are the same people who were middle-of-the-distribution at 35.
To answer that, you need panel data: the same families tracked across waves. The Panel Study of Income Dynamics, running since 1968 at the University of Michigan, is the longest household panel in the world. We pulled an extract covering net worth at four waves: 1989, 1999, 2009, and 2019.
We followed 1,665 American households from 1989 to 2019. A 30-year arc.
To be clear about what we’re measuring: this is the same households tracked through their own life stages, not the next generation. The 35-year-old head of a 1989 household is the 65-year-old head of the same household in 2019. We’re not asking “did the children of 1989 millionaires become millionaires.” That’s intergenerational mobility, a different question. We’re asking how the same households move through the wealth distribution as they age.
At each wave, we computed wealth quintiles using the panel’s longitudinal weights, then asked: of households who started in each quintile in 1989, where did they end up 30 years later?
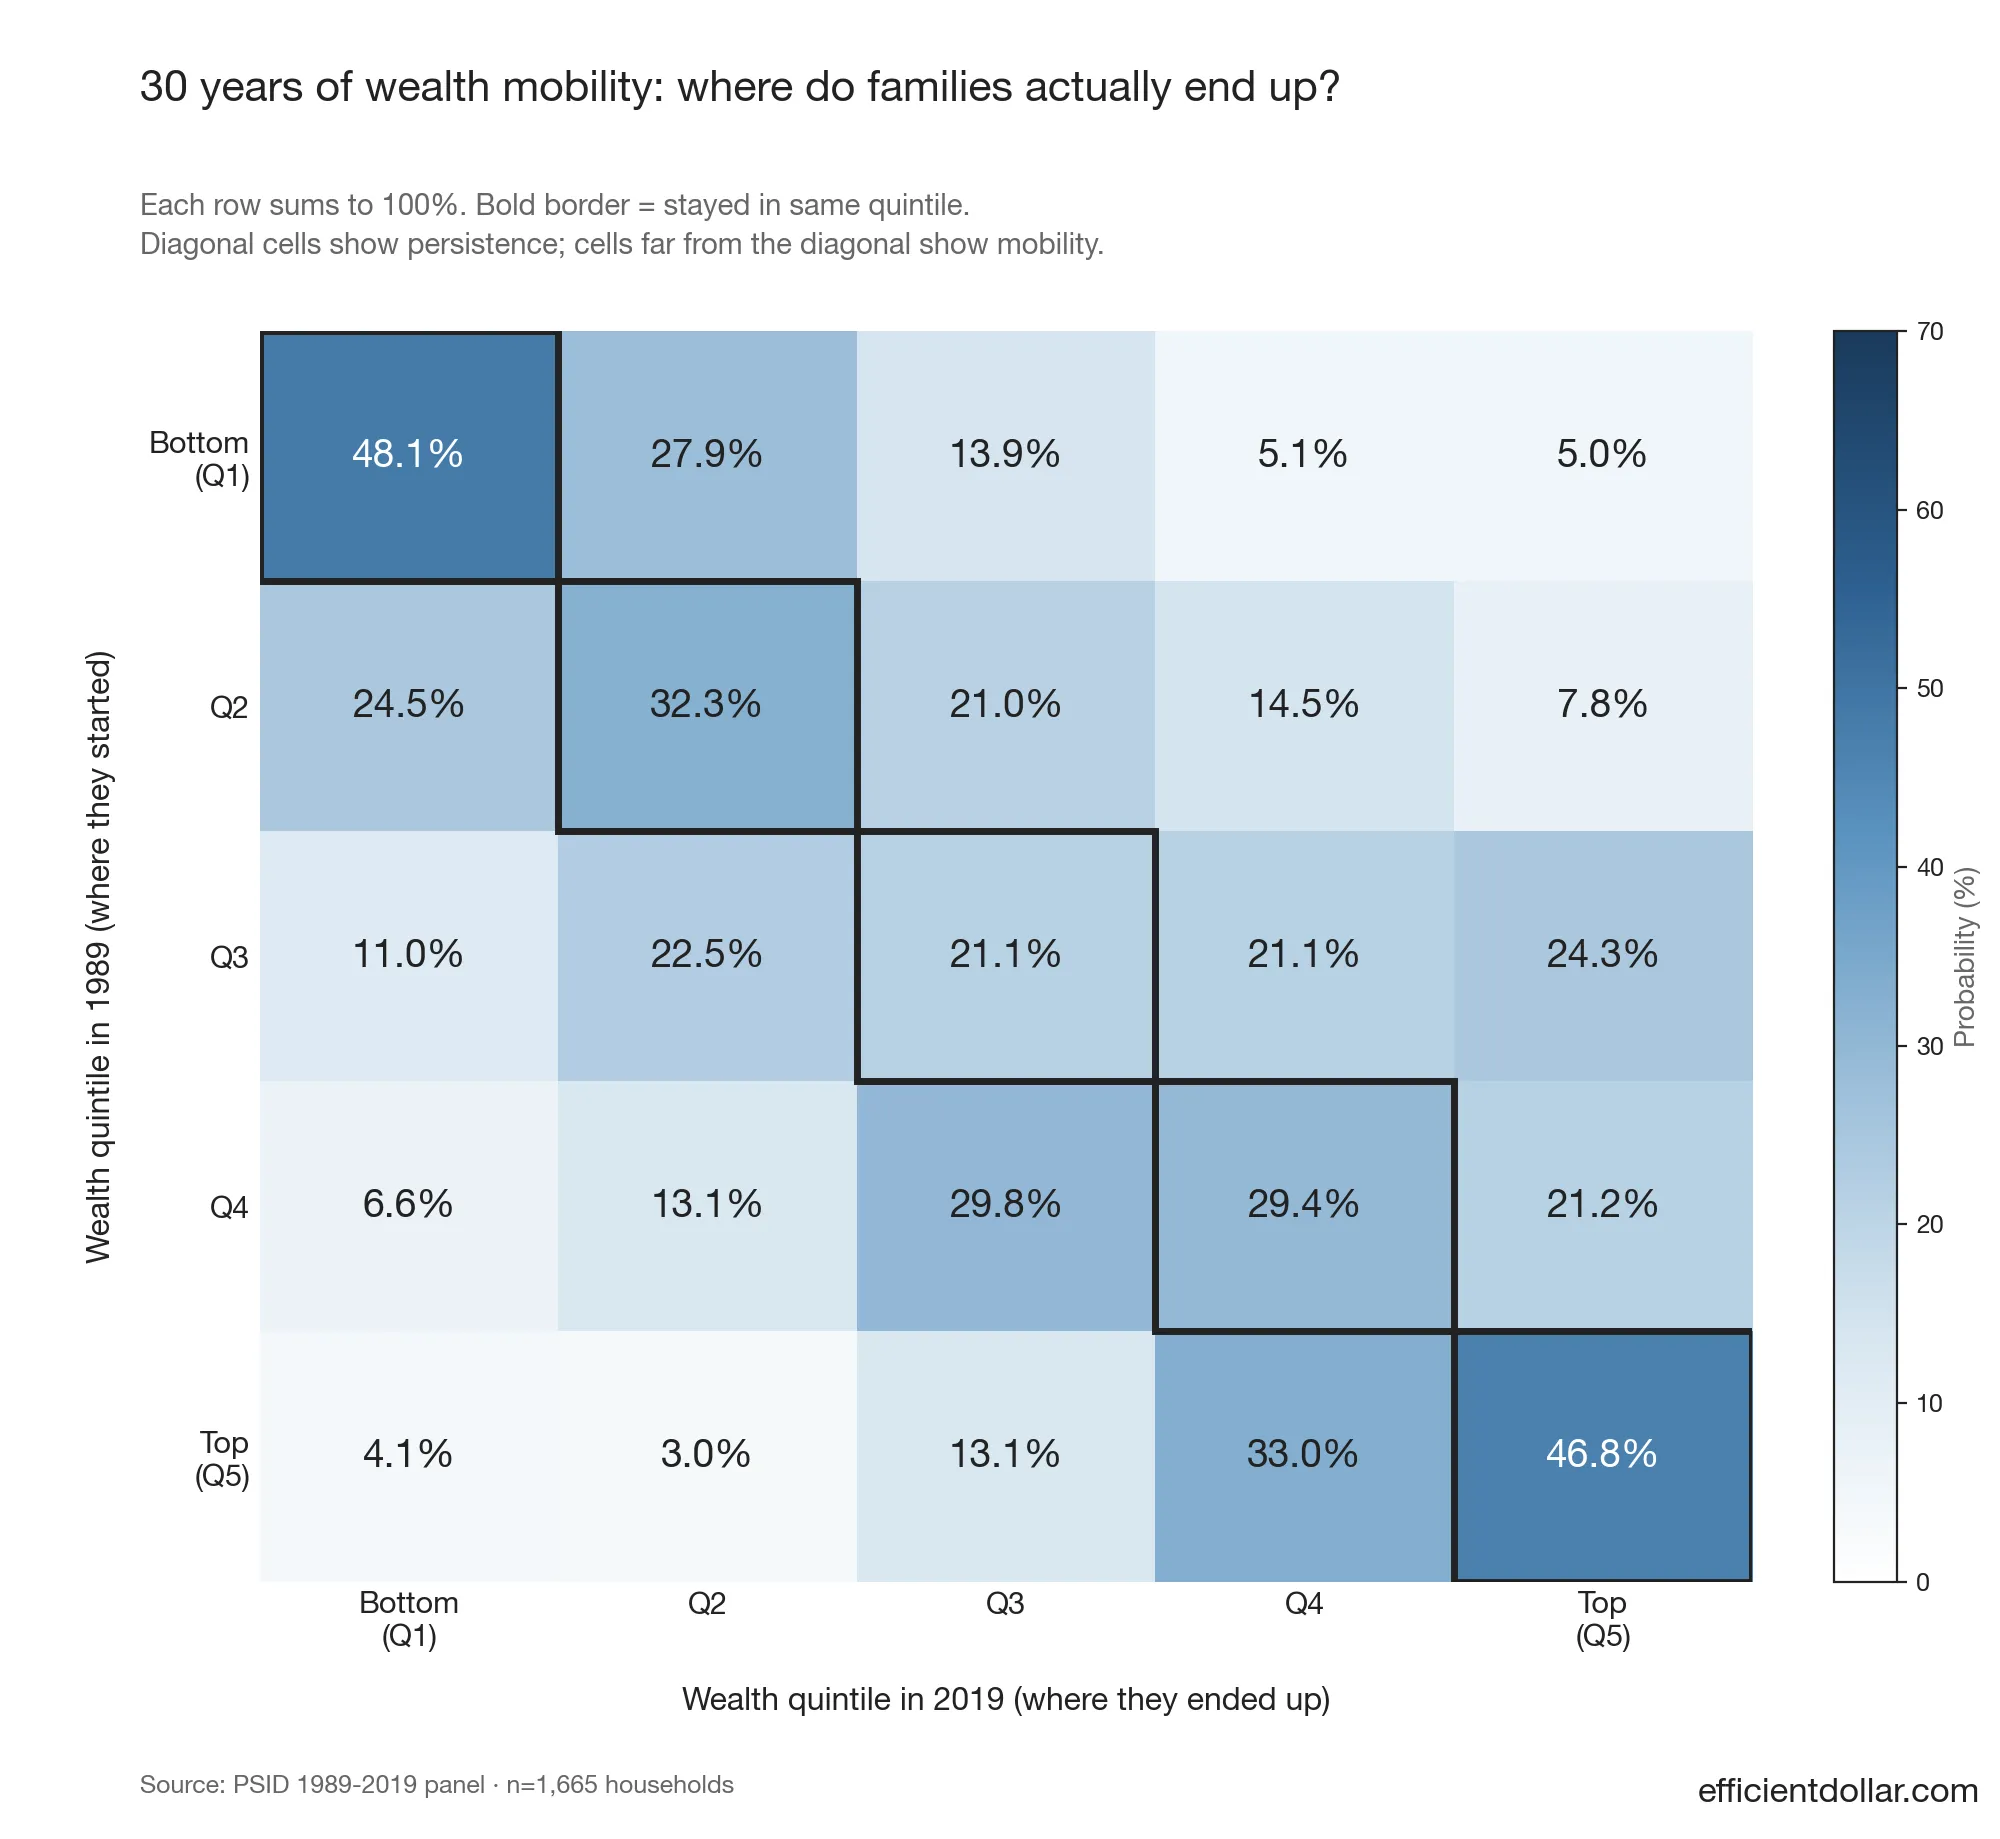
Three things stand out.
Stickiness at both ends. Almost half (48%) of households who started in the bottom wealth quintile in 1989 were still in the bottom quintile 30 years later. Almost half (47%) of households in the top quintile in 1989 were still in the top quintile in 2019. If mobility were random, persistence at each end would be 20%. It’s over 2x that.
The rags-to-riches rate is 1 in 20 over 30 years. Only 5.0% of households in the bottom quintile in 1989 made it to the top quintile by 2019. The mirror statistic is 4.1%: top-quintile households who fell to the bottom. Both are rare. Most households end roughly where they started.
The middle is mobile. The ends aren’t. Households starting in the third quintile scattered nearly uniformly across all five outcomes: 11% / 22% / 21% / 21% / 24%. The middle of the distribution is where life happens. Careers can move you up two quintiles. A divorce or medical event can move you down two. But once you’re in the bottom, half of you stays. Once you’re in the top, half of you stays.
The composition picture from the SCF section produces the mobility picture from PSID:
- The bottom 50% holds 62% of its wealth in its primary residence and 1% in business equity. There’s no compounding asset class to move you anywhere. The home appreciates at trend GDP, payroll consumes the rest.
- The $10M+ tier holds 38% in business equity. Concentrated ownership in a productive enterprise compounds at far above-market rates while it grows. Once a family has it, the same asset that built the wealth keeps it.
The structural difference isn’t only about the size of the wealth — it’s about the engine. The bottom-quintile balance sheet has no compounding mechanism. The top-quintile balance sheet has a powerful one. Both states are self-stabilizing.
The encouraging finding is the middle. Quintiles 2 through 4 (about 60% of US households) are in genuinely mobile territory. A two-decade bull market, a career arc, a paid-off house, a couple of compounding 401(k) decades. These can move a Q3 household to Q5. The same period can also move a Q4 household to Q2 if the engine breaks. The middle is where the savings-and-discipline playbook has leverage.
Billionaires: where the structural break completes
Above $10M+, the SCF gets thin. The wealth oversample tops out around the top 0.5%, and individual estimates for households worth $100M+ become unreliable. For billionaires, you need a different dataset.
The standard one is Forbes 400, the annual list of the 400 richest Americans. Forbes assigns each member a self-made score from 1 (inherited everything, never grew it) to 10 (grew up poor and overcame significant obstacles). Forbes considers anyone with a score of 6 or higher “self-made.”
The 2024 Forbes 400 finding: about 67% of the list is self-made by Forbes’ own definition. Only 25 of the 400 scored 9 or 10. Those are the true rags-to-riches stories, where someone grew up poor and built their fortune from scratch.
But “self-made” by the Forbes definition still includes people who started from a comfortable middle-class or upper-middle-class base. Joshua Rauh’s analysis at Stanford found that only 35% of the Forbes 400 were raised poor or middle-class, versus around 95% of the broader public. The other 65% started already advantaged.
What kinds of fortunes show up at this tier? The biggest categories on the recent Forbes 400:
- Technology. The largest single bucket. Up sharply since the 1980s.
- Finance. Hedge funds, private equity, asset management.
- Retail / consumer goods. About 15% of fortunes.
- Real estate. Declining as a share.
- Energy. Declining as a share.
Two patterns from this data.
At billionaire scale, almost every fortune is a single concentrated equity stake. Bezos, Zuckerberg, Musk, Page, Brin. These are people who own large positions in companies they founded or bought into very early. The composition of their wealth is, in the limit, one asset. This is the structural endpoint of what we saw at $10M+: business equity dominating everything else.
Most billionaires didn’t start poor. But most didn’t inherit a fortune, either. They started from a position of meaningful advantage. Educated parents, access to capital, professional networks. Then they built or bought into a successful enterprise. The 1-in-400 rags-to-riches story exists. It’s just much rarer than the Forbes self-made framing suggests.
The structural break we saw between $1M–$5M and $10M+ doesn’t smooth out at the very top. It intensifies. At billionaire scale, retirement accounts are a non-factor. Real estate is a non-factor. The home is a non-factor. The wealth is one company, and the question of “how do you build it” isn’t “how do you save more” but “how do you build (or buy into) a valuable company.”
The takeaway
Most personal-finance content focuses on savings rate, retirement accounts, and home equity. For the vast majority of US households, that’s where the wealth actually lives. The boring playbook works for the boring path.
But that playbook has a structural ceiling around the millionaire tier. Past that, the wealth lives somewhere different — in a business. And the playbook is different too.
A few practical implications.
If your goal is the millionaire tier, the boring path works and the data is on your side. Two earners, stable careers, max the retirement accounts, buy a home, hold it. This is roughly where dentists, engineers, teachers married to accountants, and senior public-sector workers land in their 60s.
If your goal is past the millionaire tier, you’ll need a different lever. Either you participate in the equity of a business (as a founder, an early employee with meaningful equity, a buyer-into-a-partnership) or you don’t get past the ceiling. The path is harder, riskier, and more concentrated. The data doesn’t show another way around it.
If your goal is to know where you are right now, the Net Worth Percentile Calculator takes your age and net worth and shows you your position in the US distribution. The Income Percentile Calculator does the same for your earnings. Same SCF data as the analysis above.
Wealth tiers are different countries. They speak different financial languages. The path between them isn’t always continuous. Sometimes the structure of the asset has to change, not just the size.
If you’re on the boring path, you’re on the path most American millionaires walked. That’s the good news.
If you’re aiming higher, you’re not aiming for more savings. You’re aiming for a different kind of asset, with different rules.
Either way — the data is clear about which one you’re playing.
Methodology
Primary source: Federal Reserve 2022 Survey of Consumer Finances public-use file (released October 2023, fielded 2022–23). Approximately 4,600 households interviewed, with oversampling at the top of the wealth distribution to produce reliable upper-percentile estimates. Total US households represented: ~131 million.
For wealth composition, I computed weighted aggregate dollar shares for each asset bucket within each tier and age cohort. This is the conventional Federal Reserve “share of total assets” measure. It tells you where the dollars live, not what the typical household’s balance sheet looks like.
The dollar-weighted view is heavily influenced by the wealthy within each tier. A “median household balance sheet” view would weight every household equally and shift the composition somewhat. Bottom-50% households would still be home-dominant, but the smaller categories would change. I chose the dollar-weighted view because the question is “where does America’s wealth live,” not “what does a typical household own.”
Tier definitions (using SCF 2022 distributions; thresholds from the calculator’s multi-implicate-averaged data):
- Bottom 50%: net worth below ~$192K (the median)
- 50th percentile to $1M: between the median and $1M
- Millionaire: $1M–$5M (this also captures the top 10%, since the 90th percentile is ~$1.92M)
- $5M–$10M: pentamillionaires
- $10M+: this includes the SCF’s high-wealth oversample
Single vs. multi-implicate: the composition tables in this post use single-implicate analysis (filtering to Y1 % 10 == 1, rescaling weights by 5) for first-pass speed. The composition shares are unaffected by the rescale. The percentile thresholds quoted above use multi-implicate averages, matching what the on-site calculator returns. The two approaches give nearly identical numbers (within ~3%) for population aggregates.
Sample sizes (raw, before weighting): 1,840 / 1,133 / 761 / 209 / 652 across the five tiers. The smallest tier ($5M–$10M) has the thinnest sample; estimates there are noisier but directionally consistent with neighboring tiers.
Inheritance data: the Federal Reserve doesn’t break inheritance prevalence down by wealth tier in their public Bulletin papers. The figure for total US households (~26% report ever receiving any inheritance) is from the SCF Chartbook. The “80% of US millionaires are first-generation rich” figure is from Stanley & Danko’s The Millionaire Next Door and replicated in subsequent surveys including Ramsey Solutions’ Everyday Millionaires study (10,000 millionaires, 2017).
Occupation data: SCF OCCAT1 is a four-category aggregate. Specific occupation findings (engineer, accountant, teacher, etc.) come from Ramsey’s millionaire survey, which had specific job titles. Different methodology, broadly consistent direction.
401(k) data: Vanguard’s How America Saves 2025 reports on ~5 million participants in Vanguard-administered DC plans, year-end 2024. These statistics are participant-level (not household-level) and only include people who are actively in a plan. They exclude US workers without access to a 401(k).
Wealth mobility data: Panel Study of Income Dynamics (PSID), University of Michigan ISR, 1968–2021. Custom extract J361432 covering net worth (with home equity), age, and longitudinal weights at four waves: 1989, 1999, 2009, 2019. Panel filter: individuals who were the family head in 1989 (RELATION TO HEAD == 10) with valid wealth and longitudinal weight, then traced forward to 2019 (n=1,665 in the 30-year panel). Wealth quintile breakpoints are computed within each wave using the wave’s CORE/IMM individual longitudinal weight. Transition matrix uses the starting-wave weight to compute P(end_quintile | start_quintile).
A standard caveat for panel-mobility analysis: long-running surveys lose lower-income and less-stable families faster than the broader population (panel attrition). PSID’s longitudinal weights correct for this in expectation, but the correction isn’t perfect. The “stickiness at the bottom” finding is therefore likely a lower bound on real-world stickiness; some of the bottom-quintile households who would still be in the bottom quintile dropped out of the panel.
Billionaires: Forbes 400 2024 list and self-made score. Joshua Rauh’s analysis at Stanford GSB for the “raised poor or middle-class” estimate. The structural-equity-stake observation is my read of the underlying source-of-wealth field for the top 100 fortunes.
Caveats:
- SCF is a snapshot, not a panel. It shows where households are, not the trajectory they took.
- The dollar-weighted composition view emphasizes where total wealth sits, not a typical household’s balance sheet.
- SCF top oversample is reliable to roughly the top 0.5%; above $100M household NW, individual estimates get noisy. Forbes 400 fills the very-top gap with a different methodology.
- Inheritance prevalence by wealth tier is harder to pin down precisely than the headline “80% are first-generation rich” stat suggests. Reasonable estimates put inherited-wealth dependency at roughly 15–25% of millionaire households, varying with definition.
Newsletter
Want more research like this?
Original research on personal finance and economics, sent to your inbox monthly.