The American Wealth Curve: How the Gap Widens 8x Between Age 25 and 65
I’ve been staring at the latest Survey of Consumer Finances trying to make sense of one number that keeps jumping out at me.
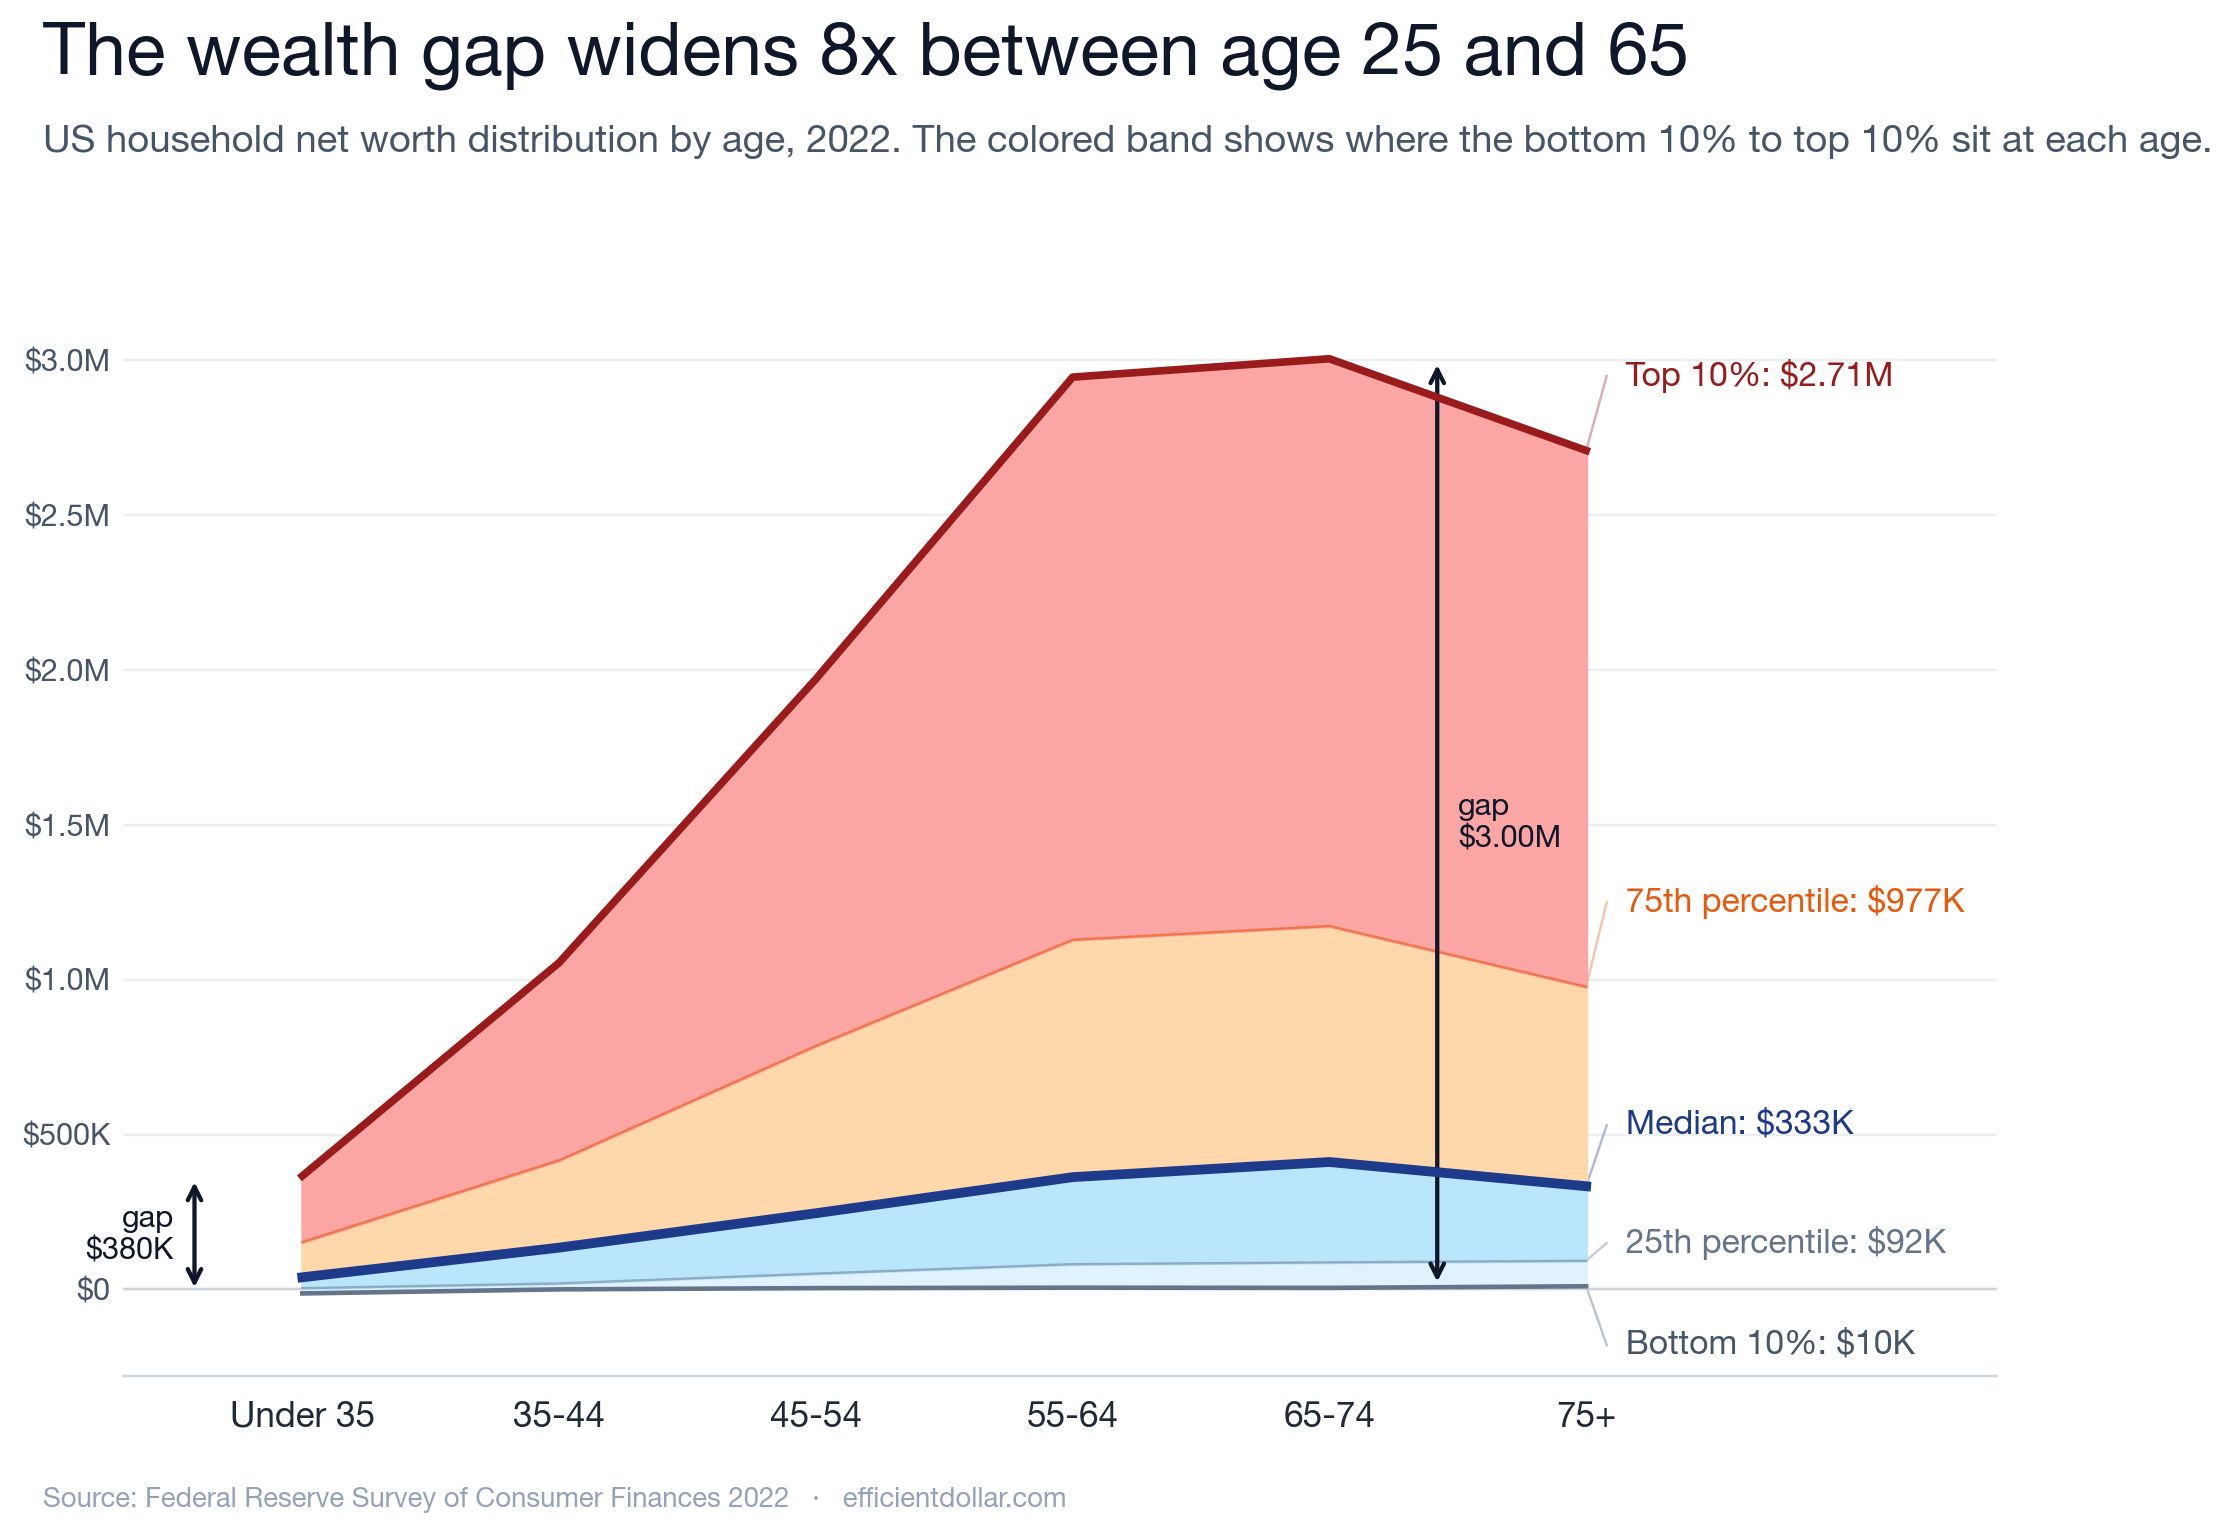
At age 65–74, the bottom 10% of US households have $4,896 in net worth.
The top 10% have $3,005,220.
That’s not a gap. That’s an ocean.
Here’s the thing about wealth and age. It doesn’t just grow. It diverges.
| Age | Bottom 10% | Top 10% | Gap |
|---|---|---|---|
| Under 35 | -$13,060 | $366,486 | $379,546 |
| 35–44 | $118 | $1,055,042 | $1,054,924 |
| 45–54 | $4,151 | $1,971,042 | $1,966,891 |
| 55–64 | $5,518 | $2,945,940 | $2,940,422 |
| 65–74 | $4,896 | $3,005,220 | $3,000,324 |
| 75+ | $10,070 | $2,708,980 | $2,698,910 |
The gap between the top decile and the bottom decile widens nearly 8x from your first decade in the workforce to your first decade in retirement.
I keep coming back to that bottom-10% column. -$13,060 under 35. $10,070 at age 75+.
Forty years of work. About $23,000 in lifetime wealth gain.
The top decile gains roughly $2.6 million across the same span.
This is what compound interest looks like when you have nothing to compound.
The Median Tells a Different Story
Your eye goes right to that red line at the top of the chart. The Top 10% climbing toward $3 million. That’s the headline.
But most people will live somewhere in the middle, and the middle has its own story.
The median 65–74-year-old has $411,358 in net worth. That sounds great until you realize half the cohort has less than that, and a quarter have less than $87,000.
Most of that wealth is sitting in home equity. The median 65–74-year-old has about $5,500 in retirement accounts. The truly portable, drawdown-able stuff.
So when people say “wealth,” what they often mean is “the house.”
Why the Curve Fans Out
Three things are doing the work here. None are subtle.
Capital compounds. Wages don’t. If you own equities, businesses, or real estate, your wealth grows on autopilot. If your wealth is your paycheck, you earn it and you spend most of it. The cycle resets every two weeks.
The bottom decile has no principal. A bottom-10% under-35 household is in net debt. There’s nothing to compound. By the time the median household has $39K to invest, the top decile already has $366K in motion. Two decades of compounding on a 10x larger base produces exactly the divergence you see in the chart.
Homeownership is the middle’s wealth engine. Forty years of mortgage payments on an appreciating asset. It’s a forced-savings program with leverage. And it’s effectively unavailable to households without a down payment.
I always say wealth is built quietly, over a long time, with consistent effort. That’s still true. But the slope of that curve depends a lot on where you started.
A Caveat Worth Naming
The Fed’s net worth measure doesn’t include the present value of future Social Security or pension flows. For lower-income retirees, those are huge. Often the single largest financial asset they have.
So a 70-year-old at the 10th percentile with $5,000 in the bank and $24,000 a year in Social Security has more total resources than the chart suggests.
But what the chart shows is transferable, inheritable wealth. That’s what gets passed on. That’s what determines whether the next generation starts the race at -$13K or at $366K.
Generational wealth doesn’t move through Social Security checks.
The Takeaway
A few things stand out.
The gap between the haves and have-nots widens with every passing year, and the math behind that isn’t going to change anytime soon. Compounding is relentless, in either direction.
But the median outcome is more reachable than the chart makes it look. $411K in net worth by your late 60s is not Top 10% wealth, but it is a real cushion built mostly on patience, payroll savings, and home equity. Boring stuff. Boring works.
If you want to know exactly where you stand right now, the Net Worth Percentile Calculator takes your age and net worth and returns your position within your age cohort. Same SCF data as the chart.
Knowing where you are is the first step toward deciding where you’re going.
Methodology
Source: Federal Reserve 2022 Survey of Consumer Finances, public-use file (released October 2023, fielded 2022–23). Approximately 4,600 households interviewed, with oversampling at the top of the wealth distribution to produce reliable upper-percentile estimates.
For each SCF age cohort of the household reference person, I computed the 10th, 25th, 50th, 75th, and 90th percentiles of household net worth using SCF sample weights. Net worth is total household assets minus total household debts.
Total US households represented: 26,261,278.
Newsletter
Want more research like this?
Original research on personal finance and economics, sent to your inbox monthly.